Firm prepares to cut thousands of jobs worldwide as pandemic creates uncertainty. BP has warned that the oil market continues to face a volatile future because of the coronavirus pandemic as it prepares to cut thousands of jobs from its global workforce within weeks.
The oil giant returned to a modest underlying profit of $86m (£66m) in the third quarter but warned on Tuesday that the effects of the Covid-19 outbreak had created a “challenging” environment for the company.
The underlying profit, which is the figure most keenly watched by the market, was better than the $120m loss predicted by equity analysts, but was a fraction of the $2.3bn reported for the same quarter last year, because of the collapse of global oil prices.
The price of Brent crude averaged $42 a barrel in the third quarter, up from $30 over the previous quarter, when BP slumped to a $6.7bn underlying loss that included a string of writedowns on its exploration assets.
BP said the “ongoing impacts of the Covid-19 pandemic continue to create a volatile and challenging trading environment”, and added that the recovery remained uncertain.
The oil company delivered the warning less than a week after its share price plunged to lows not seen since 1994.
BP is cutting 10,000 jobs from its global business at a cost of $1.4bn to weather the downturn and help shore up its finances as it shifts towards low-carbon energy. Investor jitters over the global industry, and BP’s bold climate targets, have caused the oil company’s share price to tumble to 26-year lows of 200p a share in recent weeks. It fell further, down more than 2% to just below 196p a share, following the latest quarterly results.
BP said it had reduced its headcount by about 2,800 people so far, in part through a voluntary redundancy programme. Thousands more will follow in the coming weeks with BP aiming to complete the majority of the cuts this year.
Bernard Looney, BP’s chief executive, assured investors that the company would keep its existing dividend policy in place after reducing it by half in August, the first cut since the Deepwater Horizon oil spill in 2010. He also promised that the oil giant’s move towards low-carbon energy would be based on projects which offer strong returns.
“Having set out our new strategy in detail, our priority is execution and, despite a challenging environment, we are doing just that – performing while transforming,” he said.
Looney said in May that the collapse in oil market prices triggered by the coronavirus meant he was “more convinced than ever” that BP’s low-carbon transition was necessary. The company took its first steps into the offshore wind market months later by taking a $1.1bn stake in two US offshore wind projects being developed by the Norwegian state oil company Equinor.
BP’s energy economists have said demand for oil may never recover after the pandemic, which has taken a heavy toll on transport industries, and may be on the brink of an unprecedented decades-long decline.
The company slashed the value of its oil assets this year to reflect its view that oil price forecasts would be below expectations as a result of the pandemic. The write-offs led to a net loss of $16.8bn in the second quarter, but in the absence of further writedowns BP reported a fifth consecutive net loss of $500m for the last quarter.
The Abu Dhabi National Oil Company (Adnoc) said that its new trading entity Adnoc Trading has started derivatives trading as a direct market participant.
This represents a major milestone for the company, as it moves from being a traditional marketer of its products to a more sophisticated global trader.
Adnoc has incorporated two trading units, Adnoc Trading (AT), which focuses on the trading of crude oil, and Adnoc Global Trading (AGT) a joint venture with ENI and OMV that will focus on the trading of refined products. The new offices of both AT and AGT are located in Abu Dhabi’s International Financial Centre at Abu Dhabi Global Market (ADGM).
Adnoc Trading is now operational and Adnoc Global Trading is on track in establishing the required processes, procedures and systems to begin operations in the coming months. The AGT trading team are already optimizing Adnoc’s flows (crude, feedstock and product optimization), and, as its new trading systems are finalized will ramp up its activities.
By entering trading, Adnoc is able to offer a broader range of services to its customers and capture more value through new revenue streams from the sale of its growing crude and refined products portfolio. This significant step is a critical enabler of Adnoc’s 2030 strategy and its drive to become a more commercially-driven and performance-led organization.
Dr Sultan Ahmed Al Jaber, UAE Minister of Industry and Advanced Technology and Adnoc Group CEO, said: “This historic achievement is yet another important milestone for Adnoc as we become a more modern, agile and progressive energy company. Our steadfast focus is on providing a better service to our customers, while also stretching the margin from every barrel of oil that we produce, refine and trade. Our move into trading supports both of these goals.
“The opening of our trading offices at Abu Dhabi Global Market (ADGM) further reinforces its position and reputation as a leading and growing commodities trading hub for our nation and the Middle East region.”
The opening of its trading offices further demonstrates Adnoc’s resilience in overcoming the unprecedented challenges of the Covid-19 pandemic.
Khaled Salmeen, Executive Director of Adnoc’s Marketing, Supply and Trading directorate and Chairman of Adnoc Trading said: “Adnoc has continually adapted during Covid-19 to deliver on its commitments to domestic and international customers, including our landmark move to forward pricing of Abu Dhabi crudes. In 2020, our plans for Adnoc Trading and Adnoc Global Trading become a reality. In the weeks and months ahead, Trading will become integral to how Adnoc manages its business, helping us to better manage our product flows, deliver greater efficiencies, and provide our customers with a broader service and more integrated solutions.”
Safeguards are in place to oversee and track all trading activity. The trading systems used by AGT and AT have undergone thorough testing to ensure that they are ‘air-tight and water-tight’ before operations begin. In order to manage and control risk, the expert trading teams use a suite of energy trading and risk management systems that cover the full life cycle of every trade.
The establishment of Adnoc’s new trading entities is part of the company’s broader transformation in its customer-facing Marketing, Supply and Trading directorate (MS&T). Adnoc’s marketing arm is moving from a supplier that customers historically collected products from, to a more customer and market-centric, shipping & integrated logistics, storage and trading organization.
By better integrating its marketing related companies and capabilities, Adnoc will provide a broader service to its customers, better manage and optimize its product flows and ultimately deliver greater value to its customers, its shareholders and the UAE.
In shipping, Adnoc Logistics & Services (Adnoc L&S) is the largest, fully integrated logistics and shipping company in the UAE and provides highly specialized services that cover the entire oil and gas supply chain. Adnoc L&S is expanding its merchant fleet in line with Adnoc’s growing upstream and downstream portfolio and the company’s move into trading.
In storage, in addition to substantial storage in the UAE and international storage in Japan and India, Adnoc announced in 2019 a strategic investment in global storage terminal owner and operator VTTI BV (VTTI). VTTI is an independent global owner of 15 hydrocarbon storage terminals across 14 different countries, many of which are in locations that are complementary to Adnoc’s trade flows.
Finally, by entering trading, Adnoc will be able to provide a wider offering to its customers, more nimbly take advantage of changing market dynamics, and better manage its product flows, assets and risks.
China has played a significant role in supporting global oil demand recovery in recent months by importing its highest-on-record crude volumes since May. Customs import data from the world’s top oil importer continue to show strong arrivals of crude as ports and customs continue to process cargoes that have waited for weeks to discharge.
However, with demand recovery in the rest of Asia still wobbling and refining margins in the region still depressed, the oil market and oil analysts have one primary concern about demand on their minds. How long can China support the fragile global oil market, when backlogged cargoes are finally processed and demand outside China is still weak, with the outlook getting weaker as the second wave of coronavirus infections is sweeping across major developed economies?
Over the past five months, China’s crude oil imports haven’t fallen below 11 million barrels per day (bpd), with June arrivals of 12.9 million bpd smashing the previous record from May by more than 1.5 million bpd.
The key reason for the record level of Chinese imports over the spring and summer was the buying spree of China’s refiners in March and April when oil prices crashed and hit the lowest in more than 15 years at the end of April. State and independent refiners rushed to stock up on dirt-cheap oil loading in the spring, which started to show up in Chinese imports as early as in May.
The Chinese recovery from the pandemic supported the global demand recovery early in the summer, while arrivals of cheap cargoes purchased in the spring continued to give the oil market hopes later in the summer when demand recovery elsewhere started to falter with the second wave of COVID-19.
China’s ports were so congested with cargoes that tankers had to wait for weeks to discharge the crude, which then clears customs and is shown in the customs import figures.
Port congestions have started to ease in recent weeks, however, suggesting that Chinese imports are on the road to return to ‘normal’ levels in the coming months.
“After growing for five consecutive months, floating storage in China fell for the first time, indicating that port congestion has started to ease,” OilX’s oil analysts Juan Carlos Rodriguez and Valantis Markogiannakis wrote in a report earlier this month.
China’s oil imports continue to grow compared with previous years, but they are easing off the record-highs seen this summer.
But what will happen once the backlogged cargoes are processed? Can the world’s largest oil importer continue to support oil demand recovery when major economies in Europe are back again under tougher restrictions on social gatherings? Will Chinese refiners have an incentive to process more crude when fuel demand in the rest of Asia is still weak?
According to Refinitiv Oil Research, reported by Reuters’ columnist Clyde Russell, China’s October oil imports will likely see the last effect of the backlogged cargoes, with some 635,800 bpd estimated to have been delayed from September to October.
After that, it’s anyone’s guess how much oil China would import at what could be the normal levels.
Some independent refiners, the so-called teapots, have reportedly already used up their government-allocated import quotas for 2020, and could be inactive on the market for the rest of the year.
On a bullish note, a large private refiner is said to be stocking up on millions of barrels of crude from the Middle East in preparations for trial runs at a new refinery, helping to absorb some of the crude oil from the Middle East amid an otherwise depressed market with stalled demand recovery.
The market could probably be fairly certain that Chinese oil imports in the coming months are unlikely to beat the records from earlier this year.
Yet, the unclear outlook about China’s import volumes in the fourth quarter adds another uncertainty for the oil market to deal with until the end of 2020, on top of the increasingly uncertain outlook about demand recovery and supply growth from Libya.
OilPrice.com, Editor: Tsvetana Paraskova, October 30
The tank terminal market is very fragmented, with more than a thousand terminal operators and five thousand terminals worldwide. Furthermore, the market dynamics these terminals operate within can be quite complex, making it hard for investors to assess the true value of a prospective asset. In this blog, we’d like to present you with the 5 biggest pitfalls to burn money in terminal investments.
Tank terminals are considered infrastructure assets with a low-risk profile that generate stable revenue streams. Therefore, it’s hardly surprising that we see a significant uptick in interest for tank terminals investments during these uncertain economic times.However, we have also seen even seasoned investors getting lost in the world of tank terminals.
The tank terminal market is very fragmented, with more than a thousand terminal operators and five thousand terminals worldwide. Furthermore, the market dynamics these terminals operate within can be quite complex, making it hard for investors to assess the true value of a prospective asset.
In this blog, we’d like to present you with the 5 biggest pitfalls to burn money in terminal investments.
1. Lacking knowledge
When assessing the market worth for a tank terminal, only looking at the bottom line will not be enough. Competitive value comes from collecting and understanding data on a terminal’s location, infrastructure, activity level, et cetera.
That’s why it’s key to get access to industry-specific knowledge and get a complete picture of the asset you are interested in.
2. Paying a price which is too high
Given the complexity and dynamic of the Tank terminal industry, make sure you have a solid understanding of the key performance indicators of the terminal. What are the throughput levels? What are excess throughput levels? How are contracts being structured? What are the occupancy rates of the jetties?
Only if and when you partner with an advisor who understands the industry and will provide you with the essential and detailed insights, you can build your investment case and valuation model, minimizing the risk of bidding too high.
3. Lacking an exit plan
Even though this is true for all sorts of investments, you’ll need to pair a sound investment plan with a solid divestment strategy. Knowing when to sell is just as valuable as knowing when to buy. When market dynamics are changing and divestment of your assets is the smart move to make, a solid exit strategy is invaluable when it’s time to act.
4. Low probability of winning the bid
Being a successful investor is not only about being able to identify a good investment opportunity; it’s also about knowing when to pass on a bid.
If there is too much competition or if you expect you will be willing to pay the expected price, it is better to exit the process at an early stage. By using a phased approach, you’ll never end up investing a tremendous amount of time and money on a bid that would never be successful.
5. Expecting high returns for low-risk investment
You can’t have your cake and eat it, too. While investments in infrastructure assets like storage terminals are often a great addition to your investment portfolio, be sure to have realistic expectations of your return on investment. While it may seem a bit ‘boring’ in the world of stock shorting, high-frequency trading and venture capital, investing in tank terminals is considered a low-risk investment with respectable returns.
What’s next?
Now you know what you shouldn’t do, you might want to know what you should do to become a successful investor in the tank terminal industry.
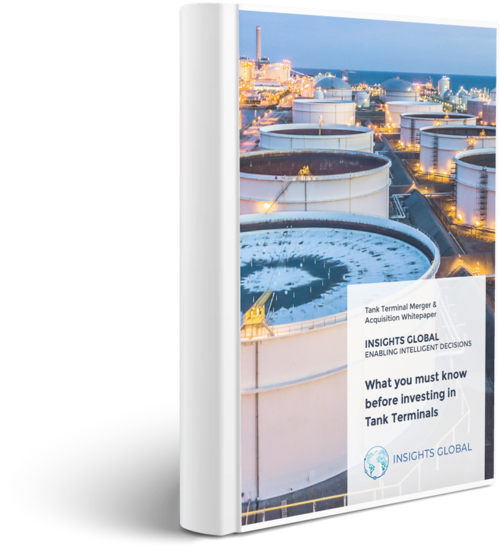
Download our whitepaper “What you must know before investing in tank terminals.”
In the last blog article, we explored
the impact of the super contango and COVID-19 on tank storage demand in the
four major oil trading hubs Amsterdam-Rotterdam-Antwerp (ARA), Houston,
Singapore, and United Arab Emirates (UAE).
We concluded that the main trading hubs
showed similar patterns by looking at the statistics of tanker visit numbers,
marine gross trade and average berth occupancy rates, especially in the first
quarter of 2020 in which the defining events OPEC+ conflict and COVID-19
evolved.
We said that in the first quarter
of 2020 the number of tanker visits of the different hubs was at a minimum
while the average berth occupancy rates were at their second highest since the
third quarter of 2017. The low number of tanker visits was likely to have been
caused by 1) high fill rate or
almost full tanks of terminal operators due to contango storage play options
and 2) lower consumption levels due
to demand destruction by COVID-19.
The high berth occupancy rates
can be explained by the fact that, despite the low number of tanker visits, in
the first quarter of 2020 terminal operators were coping with the impact of IMO
legislation to their business operations which might have resulted in a bit
slower vessel handling at the terminals.
In this blog article we will
focus on the second quarter of this year when the pandemic – in certain areas – was at its height. We will analyze what the
impact of the super contango and COVID-19 had on tank storage demand in the
major trading hubs has been, individually and combined.
Tanker Hub Visits Per Quarter
For all trading hubs consolidated
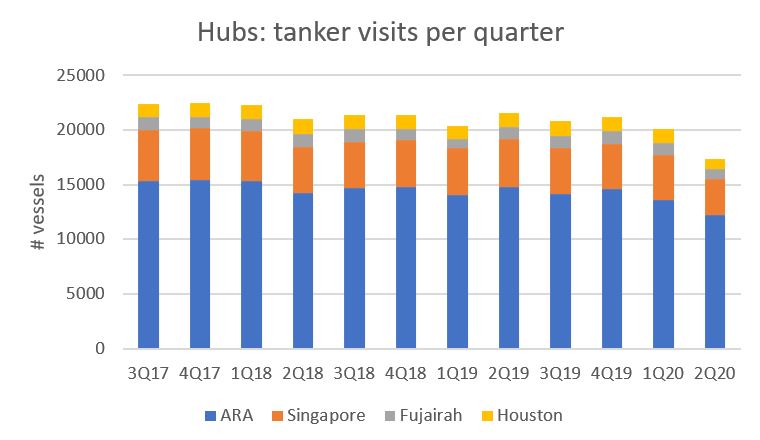
the number of tanker visits dropped to a new low in the second quarter of 2020,
with 13% less tanker visits compared to the previous quarter and even 19% less
tank visits compared to the same quarter a year ago. Looking at the tanker
visits trend (figure 1), all trading hubs show a similar trend with a
continuation of the downward trend in 2020. For all hubs, with the exception of Fujairah, in the
second quarter of this year the minimum value of tanker visits was reached
since the third quarter of 2017. For Fujairah it was the second lowest
number. The 2Q20 value for ARA was 12,184 tanker visits which is 10% lower
q-o-q and 18% lower y-o-y. Singapore showed the strongest decrease in
comparison with the other hubs. In the second quarter of 2020, the Asian port registered
20% less tanker visits in comparison with the first quarter of the year. The
value for 2Q20 was 3,305. In relation with last year’s second quarter, the
number of tanker visits was reduced with almost a quarter. In Fujairah there
were 893 tanker visits seen in the second quarter of 2020. That was 19% lower
than last quarter and 23% lower than the second quarter of 2019. The lowest
value in Fujairah was 878 tanker visits in the first quarter of 2019. Houston
registered 999 tanker visits in 2Q20. That meant 20% less tanker visits q-o-q
and 22% less tanker visits y-o-y.
Figure 1: Tanker visits per hub per quarter; source TankTerminals.com
Marine Gross Trade Per Hub Per Quarter
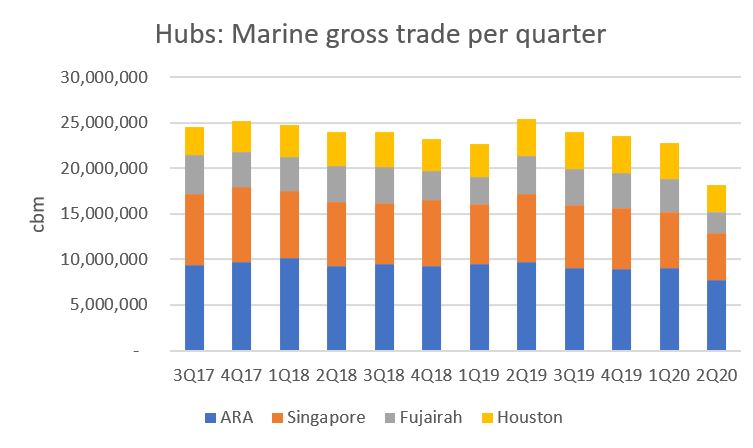
With respect to marine gross
trade volumes we see a striking resemblance in the trend of the major trading
hubs (figure 2). For all
the hubs, it applies that marine gross trade in the second quarter of this year
was at its lowest since late 2017. The 2Q20 value in ARA was 7.7Mcbm
while its average volume over the last 12 quarters was 9.3Mcbm. That is a 15%
drop since last quarter and a 21% drop since last year. In Singapore, the 2Q20
value stands at 5.5Mcbm while the average numbers stands at 6.9Mcbm. This is a
16% decrease q-o-q and a 25% decrease y-o-y. In Fujairah these numbers are even
more substantial. The minimum value in 2Q20 was 2.4Mcbm and the average value
was 3.6Mcbm. The drop compared to last quarter was 31% and compared to last
year even 41%. Houston numbers stood at 2.8Mcbm in the second quarter while the
average stood at 3.6Mcbm. This means a q-o-q decrease of 26% and 30% y-o-y. For
the hubs combined, we saw 20% drop q-o-q and 27% drop y-o-y.
Figure 2: Marine gross trade per hub per quarter; source TankTerminals.com
Berth Occupancy Per Hub Per Quarter
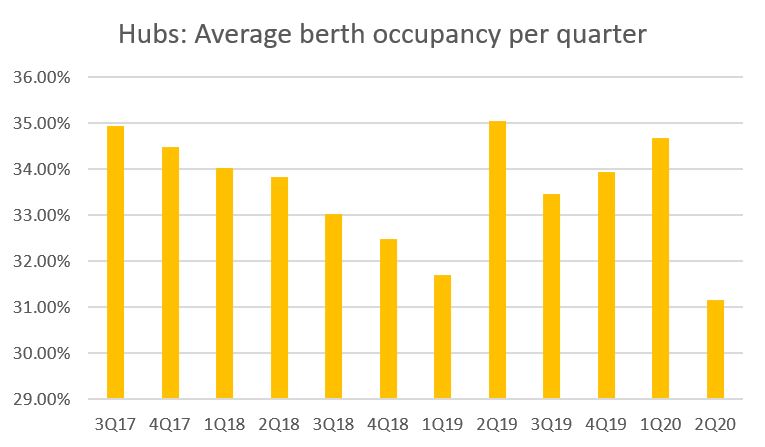
All major trading hubs showed a
similar trend in berth occupancy rates in the second quarter of this year
(figure 3). The rates showed a decrease compared to the last quarter while for ARA, Singapore and Houston the
berth occupancy rates were at their lowest since the third quarter of 2017.
For Fujairah, berth occupancy rates showed their third lowest value. The
average berth occupancy in the ARA stands at around 32% while 2Q20 value stands
at 31%. In Singapore and Houston these values are even more dramatic with an
average berth occupancy of both hubs at 33% while the value in the 2Q20 was
just below 30%. In Fujairah the average berth occupancy stands at 35.5% and the
2Q20 number was 32%. For the hubs combined we saw an average berth occupancy
value of almost 31% (minimum) in the second quarter while the average stood at
33.5%.
Figure 3: Average berth occupancy per quarter; source TankTerminals.com
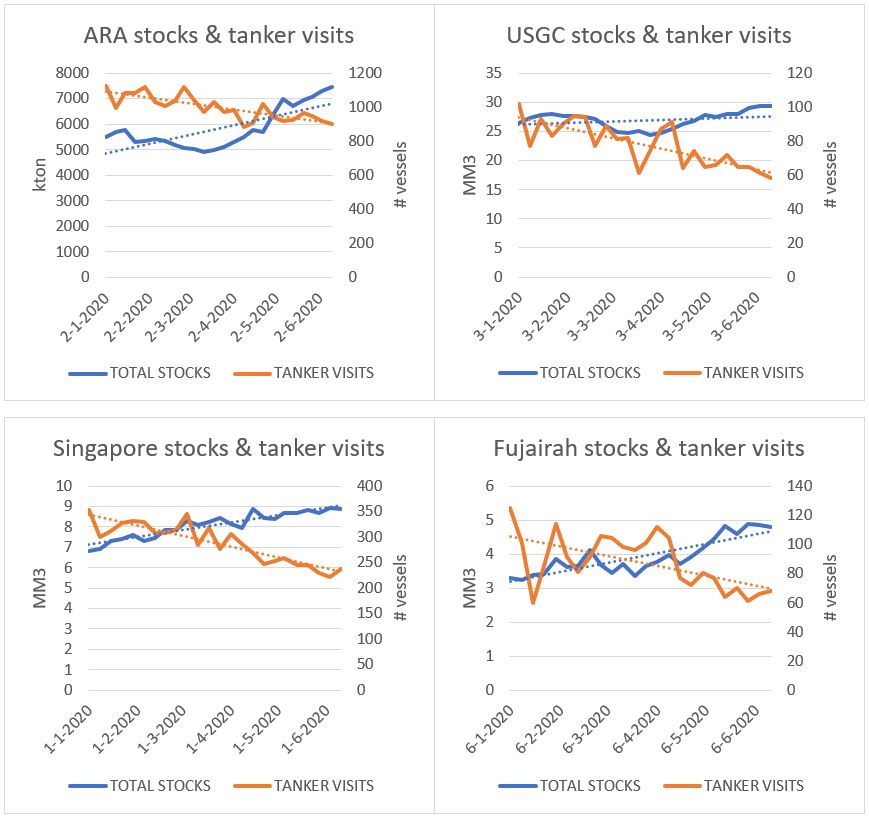
Stock numbers versus tanker visits
For all major hubs light end, middle
distillates and heavy end stocks combined have been building this year (figure
4). The growth rate for the hubs is different but stock levels show a similar
pattern and that is an upward trend. The same relation is visible for the
tanker visits although a negative trend as the number of tanker visits for all
hubs have been declining.
Figure 4: ARA stock levels and tanker visits; source TankTerminals.com
Conclusion
Especially for the tanker visits
and marine gross trade of marine terminals it can be concluded that due the
COVID-19 pandemic demand for fuels has been severely weakened which resulted in
less product being moved to and from terminals. This trend was already visible
in the first quarter of 2020 but accelerated in the second quarter of 2020. Intelligent
lockdown, closed borders and other preventive measures in all major hubs weighed
on fuel consumption and international trade flows.
The lower demand and forthcoming
less international transports also led to a rise of consolidated oil product
stocks in all major trading hubs. Besides less oil consumption, oil product
terminals profited from the super contango which resulted in an additional build
of oil product stocks. As the charts in figure 4 show, stock levels rose in
2020 while the number of tanker visits dropped. It is striking to see that all
hubs show similar trends.
Berth occupancies in all hubs on
the other hand dropped to their lowest since Insights Global started gathering
data of terminals’ logistical performance. Also this change has been related to
the COVID-19 pandemic impact. We concluded that berth occupancies rose as from the
first quarter of 2019 till the first quarter of 2020 due to less efficient
vessel handling operations at terminals in the run up to implementation of IMO2020
legislation. We see now that lesser ships handled by the terminals due to
COVID-19 destructive demand impact weighed on terminals’ berth occupancy rates.
In general it can be concluded that the COVID-19 pandemic
and the short term super contango had a hug impact on fuel demand, trade flows
and storage demand, coinciding for all trading hubs. As current
statistics show the virus is long from defeated and if countries do not take
immediate preventive actions a second wave can be expected on the short term.
This would mean that current market dynamics will persist for this and upcoming
years.
About the authors and the data
The data in this report was
extracted from tankterminals.com database and Insights Global’s weekly ARA Oil
Product Levels publication. The data in tankterminals.com came specifically
from the logistical performance benchmarking addon, which uncovers information
on certain terminal performance indicators such as occupancy rates and turnaround
times at berth level of a terminal. To analyze the hubs, all the berth data
from the various terminals located in these specific hubs was aggregated and
offered these unique insights. Tankterminals.com has data on the logistical
performance dating back till the third quarter of 2017. Insights Global’s
weekly ARA Oil Product Levels publication is a well-established report in the international
oil trading business. Insights Global has data going back to 1995.
Jacob van den Berge has been
working for Insights Global for more than 8 years and has 10 years of
experience in the oil & gas industry. Currently he is the Head of Marketing
and Sales but used to work as an oil market analyst and industry consultant for
the company.
Contact Jacob van den Berge if you would like to discuss how our data driven company can add value to your organization by enabling intelligent decisions.
Having access to accurate, up-to-date oil storage rates is crucial to make the right business decisions.
With our Global Oil Storage Rate Report, you’ll gain access to the single and only authoritative source of storage rate information available worldwide. It will provide you with transparency on price levels in global tank storage markets regularly, so you are always in the know and can set the right ask and bid prices for your storage.
Download your FREE Sample Report now and discover what information you could have at your fingertips each quarter.
The biofuel component in gasoline and diesel has been increasing slowly but surely since 2003, but changing biofuels regulation over the next few years are set to have a strong impact on tank terminals.
Tank terminals have been instrumental in facilitating the rising popularity of biofuels in the European Union. The first EU biofuels directive—to promote the use of biofuels and other renewable fuels for transport—entered into force in 2003 and set a voluntary blending target of 2% in 2005. The biofuel component in gasoline and diesel has been increasing slowly but surely since then, but changing biofuels regulation over the next few years are set to have a strong impact on tank terminals.
In November 2016, the European Commission published its ‘Clean Energy for all Europeans’ initiative. As part of this package, the Commission introduced an updated version of the Renewable Energy Directive, which defines a series of sustainability and GHG emission criteria for bioliquids. After the EU member states reached an agreement on this proposal in December 2018, the Renewable Energy Directive II (RED II) officially entered into force.
In RED II, the overall EU target for sustainable energy sources by 2030 has been set to 32%. While the Commission’s original proposal did not include a transport sub-target, the final agreement stipulates that the Member States must require fuel suppliers to supply a minimum of 14% of the energy consumed in road and rail transport by 2030 as renewable energy. Fuels used in the aviation and maritime sectors can opt in to contribute to the 14% transport target but are not subject to an obligation.
Currently, most member states are not meeting their individual targets. However, considering that the directive has to be transposed into national law by the Member States by 30 June 2021, the European Commission will soon be legally equipped to enforce the directive.
For tank terminals, this will mean a substantial shift in blending demand. Traditionally, bioethanol consumption depends on road gasoline consumption, which is expected to decrease. However, due to higher blending mandates, ethanol demand is expected to grow. Likewise, biodiesel consumption is strongly correlated to road diesel consumption. Although diesel consumption is also expected to decrease, due to higher blending mandates we expect the demand for biodiesel to grow as well. The maximum percentage of first-generation biofuels is capped at 7%, while the rest should be an advanced / next-generation biofuel
So while we expect the net demand for gasoline and diesel to decrease due to a variety of factors (economic recession, electrification of passenger cars and cargo vans, work-from-home), the higher blending mandates will create strong growth in demand for respectively bioethanol and biodiesel. This will offset the decline in fossil fuels and increase the demand for tank terminal blending for tank terminals.
The Renewable Energy Directive II and its impact on the fuel market make it crystal clear that biofuels should be on the radar for every tank terminal operator. During our regular Market Update webinars, we offer our expert outlook on supply, demand, and trade flows and its impact on tank storage demand.
Do you want to make sure that you never miss out on important market updates? Sign up for the next webinar today, so that you are better prepared for what tomorrow will bring.
Even though the Covid-19 pandemic is still in full swing, it is safe to say that the corona-virus has had a profound impact on nearly every aspect of our daily lives. Besides the more visible effects on public health, society, and transportation, Covid-19 also sent a shockwave through the global economy.
Even though the Covid-19 pandemic is still in full swing, it is safe to say that the corona-virus has had a profound impact on nearly every aspect of our daily lives. Besides the more visible effects on public health, society, and transportation, Covid-19 also sent a shockwave through the global economy.
This economic shockwave also had its effects on tank terminals: As soon as the true scope of the Covid-19 pandemic became apparent, the oil market shifted from a backwardated market into a deep contango. Needless to say, this contango immediately led to a significant increase in demand for tank storage. Currently, the commercial occupancy rates at oil tank terminals are very high, and as a result, tank storage rates have increased by 20-30%.
This presents a somewhat unique situation for the tank terminal market. On the one hand, high occupancy rates and increased tank storage rates have a very positive impact on the short-term profitability of oil terminals. However, the consumption of oil products has seen a sharp decline and will takes years to recover fully.
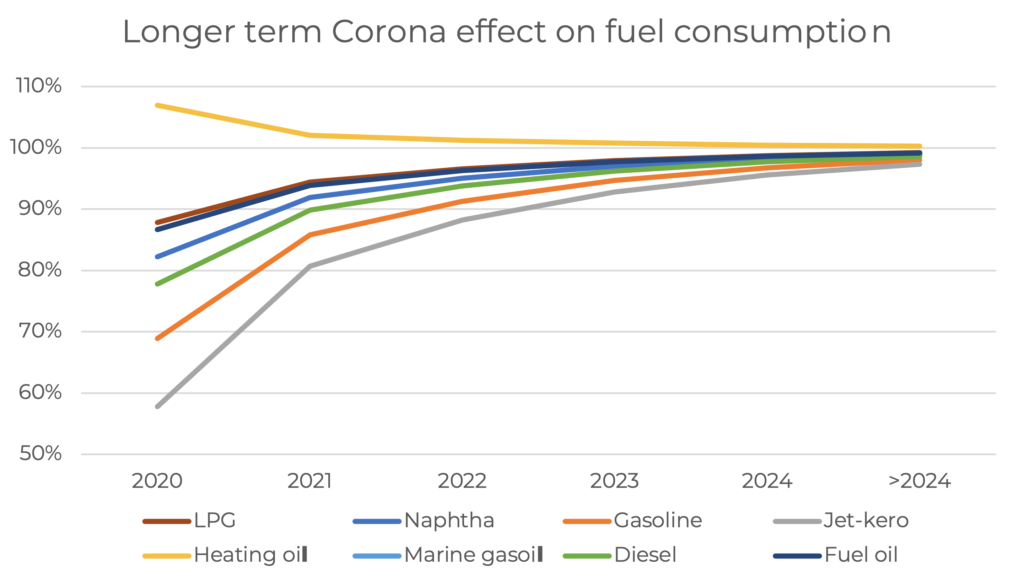
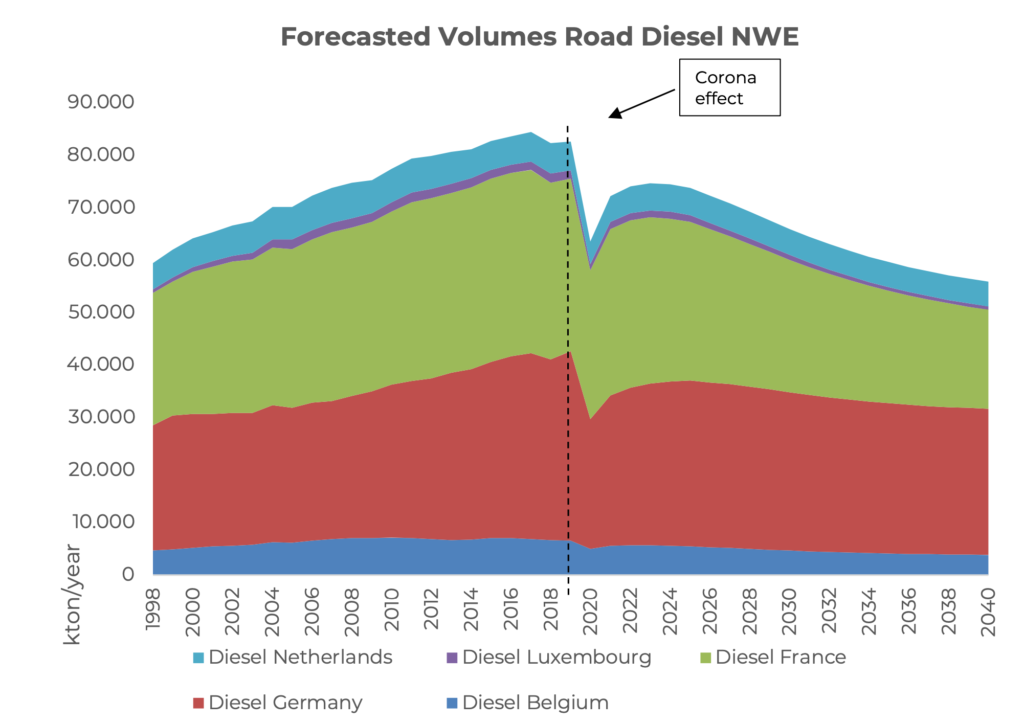
What will this mean for the tank terminal market? At Insights Global, we continuously calibrate our Advanced Tank Terminal Market Model against shifts in the market. Our algorithms take into account macroeconomic trends like oil prices, taxes, trade costs, and interest costs, and (petro)chemical factors like trade flows, logistics, and storage rates. Based on the latest economic developments, we have also incorporated the Corona effect in our forecasting models.
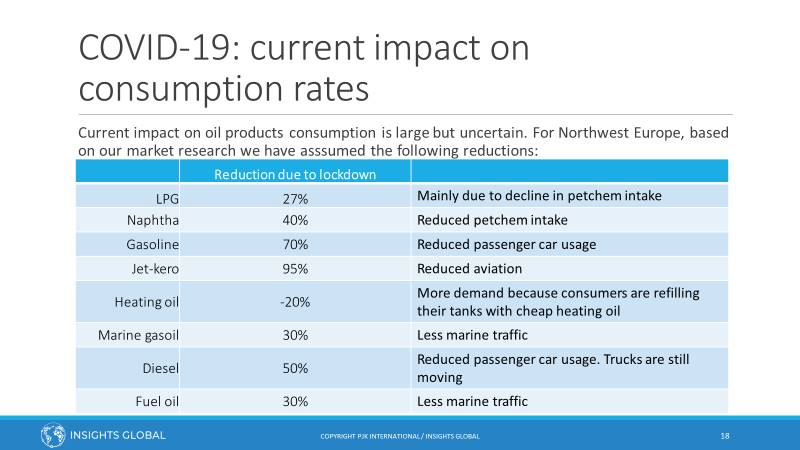
Even though the V-shaped consumption curve (sharp decline followed by a sharp increase) for oil products seems already behind us, we expect it will take five years for consumption levels to normalize fully. Jet-kero consumption is hit especially hard by the Corona-crisis, with an initial reduction of up to 95%. This slow recovery is not only caused by the impending economic recession, but also by the change of habits like working from home and replacing in-person meeting by online meetings.
While the current focus is – understandingly so – on the impact of Covid-19 on the oil market, other essential factors like the electrification of road transport, reverse dieselization of European passenger cars, and IMO 2020 regulation for bunker fuels will also play a key role in the tank terminal market. Naturally, the impact of these events is also incorporated in our Advanced Tank Terminal Market Model.
Having access to accurate, up-to-date oil storage rates is crucial to make the right business decisions.
With our Global Oil Storage Rate Report, you’ll gain access to the single and only authoritative source of storage rate information available worldwide. It will provide you with transparency on price levels in global tank storage markets regularly, so you are always in the know and can set the right ask and bid prices for your storage.
Download your FREE Sample Report now and discover what information you could have at your fingertips each quarter.
Patrick Kulsen and René Loozen of Insights Global consider the impact of COVID-19 and IMO 2020 on bunker fuel consumption and ARA tank storage demand.
The assumption is that the current lockdown lasts three months and has a negative impact on marine fuel bunker consumption levels. After the lockdown, the consumption level will gradually normalise, which will take five years.
The real impact of COVID on global and regional GDPs is not clear yet, but we may conclude that the IMO 2020 regulation have had a positive impact on the ARA tank storage demand.
As we are now well into the second quarter of 2020 it is useful to look back on the introduction of the recent IMO legislation on the regulation of sulphur emissions from bunker fuels. The dust has settled with respect to the implementation of these new rules. But as this happened a ‘black swan’ arrived on the global oil scene: COVID-19 or the Coronavirus. This pandemic and the international crisis it evoked is gripping international trade and impacting on shipping and bunker sales like nothing we have ever seen before. So, this article will also look forward to estimating the medium-term impact on bunker markets and, in particular, on bunker storage markets.
Run-up to 2020
The International Maritime Organization’s (IMO) regulation mandating a reduction in the sulphur content of marine fuels to 0.50% or below came into effect on 1 January 2020.
Leading up to the start of this new era in marine fuels there were multiple opinions or scenarios about which bunker fuels would become dominant. In first instance, most stakeholders thought high sulphur fuel oil (HSFO) would remain a dominant bunker fuel because of the expected uptake of scrubbers. Other stakeholders assumed that marine gasoil (MGO) would become main bunker fuel as there wouldn’t be enough supply of 0.50% very low sulphur fuel oil (VLSFO). Some oil majors, the International Energy Administration (IEA) and consultants then changed their opinions, believing that VLSFO would become the dominant fuel. There were other stakeholders, like the gasoil traders, who thought that the demand for MGO would increase significantly because of IMO 2020.
The first months of 2020
The first months of 2020 have shown that VLSFO seems to be the dominant bunker fuel. Consumption of MGO increased only slightly by around +10%. HSFO accounts for about 20% of total fuel oil consumption, with the rest being mostly VLSFO.
The introduction of the new VLSFOs has led to some compatibility concerns. VLSFO blends can come from residual components and distillate components. Residual components are mostly aromatic due to the asphaltenes in the bottom of the barrel. Distillates are high on paraffins. Blending these two streams together can lead to compatibility issues. This can occur if a ship switches between different batches and the fuel is mixed in the ship’s fuel tank, a process also known as commingling. The co-mingling of bunker fuels from different origins could lead to serious damage to engines or the clogging of fuel lines. VLSFO residue blends, being more aromatic, and hydrotreated vacuum gasoil (VGO), being less aromatic have these compatibility issues.
These compatibility issues also have an impact on the demand for storage capacity as some product owners have taken steps to avoid commingling new fuels in their tanks. So, this calls for segregated tanks, which will increase demand for tanks.
An important and lucrative business for oil traders in the Amsterdam-Rotterdam-Antwerp (ARA) region used to be the transhipment of fuel oil from Russia to the Far East. However, this transit flow has largely disappeared. On the one hand, the supply of Russian fuel oil has gone down whereas the demand for fuel oil in Asia has also dropped significantly. Furthermore, Asian bunker demand for fuel oil is currently being supplied from other closer regional sources. Nowadays, Russian exports are being directly exported in smaller tankers, with the US as the main destination. The ARA is no longer the heavy fuel oil transhipment hub.
Looking ahead
Our assumption in the post-2020 era is that the shipping industry will keep on using fuel oil as the dominant marine fuel (80%) but it is unclear is what the respective shares of VLSFO and HSFO will be.
In our forecasting models, the Corona effect is incorporated. The assumption is that the current lockdown lasts three months and has a negative impact on marine fuel bunker consumption levels. After the lockdown, the consumption level will gradually normalise, which will take five years. Our assumption of five years is based on experience in the past and the enormous fall of GDP which influences the consumption of fuel oil. The International Monetary Fund (IMF) forecasts a 3% contraction of global GDP in 2020, while the Eurozone will see a decline of 7.5% in 2020. It will take several years of GDP growth to be back at the same GDP level as in 2019. The consumption of bunker fuel is heavily correlated with global trade, so we expect it will take several years before bunker fuel market is at the same level as in 2019.
Due to growing bunker fuel consumption and declining average production, surplus in NW Europe will change into a deficit. Terminals in ARA specialising in fuel oil will benefit from the growing size of the fuel oil bunker market. As the number of grades has increased and more components are needed to blend into VLSFO / HSFO / MGO, more storage capacity is needed.
Additionally, on top of these structural effects on fuel oil supply, demand and imbalances, there is an enormous oversupply in the market due to the COVID-19 crisis. This has resulted in a steep contango in fuel oil forward prices and is stimulating traders to buy and store excess fuel oil supply. This provides major support for fuel oil storage rates in the short to medium term.
So, in summary, the introduction of the IMO 2020 regulation and the COVID-19 crisis have had the following impact: • More tanks needed to segregate and blend fuel grades • Less arbitrage flows limit the demand for large tanks • Long term bunker demand growth and rising imbalances will support tank demand • Short to medium term support of fuel oil storage rates due to steep contango.
The real impact of COVID on global and regional GDPs is not clear yet, but we may conclude that the IMO 2020 regulation have had a positive impact on the ARA tank storage demand. Also, in the short to medium term, the COVID-19 / Corona crisis has had a positive effect on the tank terminal business.