

Impact OPEC+ conflict and COVID-19 on tank storage demand in main oil hubs
The COVID-19 virus has a huge impact on the global oil market. The virus and the economic crisis it evoked results in a large decline of the oil demand. I this article we will describe the consequences of this drop in consumption on the tanks storage demand in main oil hubs.
A collaboration between Q88 and Insights Global, updated version
In the world of the liquid storage some 5,000 terminals can be identified. These terminals have different kind of functions. A terminal’s main function is to balance supply with demand, they can act as import terminal, as trading platform or offer strategic storage options.
Q88 and Insights Global are proud to partner to bring our clients timely information. Never before has the relevance of these terminals been highlighted, and in this article we will analyze the recent confluence of events including 1) super contango due to OPEC+ conflict and 2) demand destruction due to the COVID-19 crisis, impact tanker vessel visits, and berth occupancy at the four major trading hubs.
In the international oil and petrochemical market four main trading and storage hubs can be distinguished: ARA (Amsterdam-Rotterdam-Antwerp), Houston, Singapore and United Arab Emirates (UAE). Due to their large consuming backyard, their refinery infrastructure base and presence of a trading or financial industry, these hubs have become dominant regions in this trading industry.
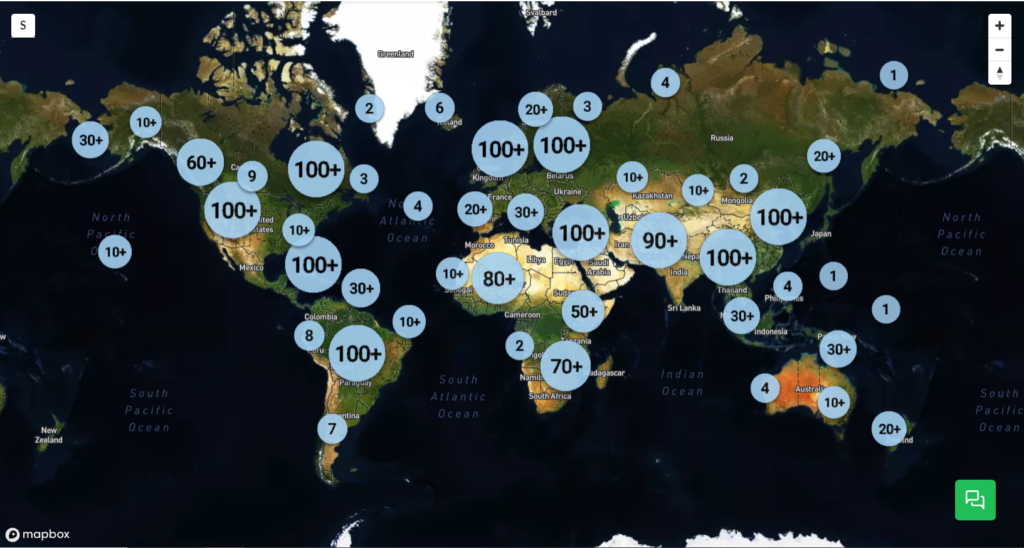
Figure 1: Location of tank terminals around the globe; source TankTerminals.com
More details of the key trading hubs
The ARA consist of 68 terminals with a total capacity of around 36Mcbm. From these terminals, 65 terminals are marine terminals. Based on capacity the most dominant player is Vopak (9.2Mcbm) followed by Koole (3.5Mcbm), VTTI (3.2Mcbm) and Oiltanking (3.2Mcbm).
The port of Houston has 52 terminals with a capacity of approximately 29Mcbm. Main players are Kinder Morgan (6.3Mcbm), Enterprise Products (4.7Mcbm) and Magellan Midstream (4.2Mcbm). Of these terminals, 35 terminals have barge access and 24 terminals have sea access.
Singapore has 21 terminals with a total capacity of 16Mcbm. The biggest storage player in this area is Vopak (3.3Mcbm), followed by Oiltanking (2.5Mcbm) and Universal Group (2.3Mcbm).
The UEA consists of 61 terminals with a capacity of 18.5Mcbm. 20 of these terminals have sea access and 11 have barge access. The most dominant storage player is Vopak (2.6Mcbm), ADNOC (2.3Mcbm) and Horizon Terminals (1.7Mcbm). All these terminals are marine terminals.
“When deep-diving the global tank storage market and specific areas, it absolutely essential to understand how many storage capacity there is, how many players are active and what their position is”, according to Jacob van den Berge, Marketing and Sales Manager at IG. “This is the first step in defining the competitive landscape of the industry.”
Major events and their impact on storage demand further explained
Super contango due to OPEC+ conflict
What is contango? A contango is a situation where the price of front month oil futures is lower than oil with future delivery. If the spread between these prices is large enough to cover storage, finance and shipping costs, a trader is able to make a profit by buying oil now and selling it on the futures market for a later delivery. However, in order to capitalize on this profit, a trader needs storage (and transport) capacity. That is what happened in the first quarter of 2020 with massive demand for storage in ARA and the other key trading hubs resulting in high occupancy rates, putting a premium on free tank capacity now.
As the contango market structure persists and there is a lack of onshore storage facilities, traders are turning to tanker vessels to store their precious hydrocarbons.
This situation was heightened when Russia and Saudi Arabia could not come to terms regarding the height of production cuts to stabilize the fall in oil prices and Russia stepped out of the OPEC+ alliance. This resulted in Saudi Arabia offering its crude with huge discounts to its international customers, which triggered a free fall of oil prices and resulted in a super contango.
The recent peace between these two top producing countries and the subsequent OPEC+ deal has only reduced the speed of oil prices declining. The recent negative WTI oil prices show that we are far from balancing the market.
“Having an understanding of these key issues is imperative while calculating potential earnings,” says Chris Aversano, Product Manager at Q88.com. He continues, “Many of our products have earnings estimators that are built-in, giving our clients a greater understanding of the marketplace.”
Demand destructive impact of COVID-19
As we know, Coronavirus originated from China, and initially affected only China and its enormous economy. However, as the virus spread, different government lockdown interventions were initiated and economies came to a standstill. Less consumption, less production, less trade and less investments caused demand to be reduced significantly, all occurring in the first quarter of 2020.
A new feature in TankTerminals.com, called the Logistical Performance Benchmarking add-on, enables us to see what’s going on at terminals on a weekly basis. Amongst others, we can look at the activity levels at tank terminals.
So what did the numbers at the terminals of these major trading hubs show? Is there any impact of the super contango and COVID-19 crisis visible?
Putting It All Together
Tanker visits per hub per quarter
In figure 2 it can be seen that the number of tanker vessels visits at the marine terminals of the different hubs, ARA and Singapore show a similar pattern as applies for Fujairah and Houston. For ARA and Singapore applies that the peak of the visits were at the end of 2017 and the least visits in the first quarter of 2020. For Houston and Fujairah applies that highest number of tanker visits was in the second quarter of 2018 while the lowest number of tanker visits were seen in the first quarter of 2019.
Figure 2: Tanker visits per hub per quarter; source TankTerminals.com
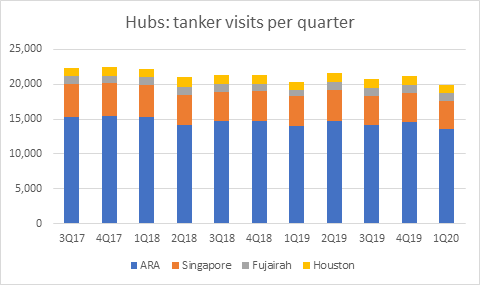
The maximum value in ARA was 15405 tanker visits and the minimum value with 13591. In Singapore, the maximum value was 4756 and the minimum value was 3956. For Fujairah the maximum value was 1196 and the minimum value was 878. The maximum value in Houston was 1372 and the minimum value was 1153. As can be derived from the number of tanker visits, the ARA region accounts of almost 68% of all tanker visits of these four hubs combined. This is because of the extensive use of tanker barges and coasters in this area to distribute products within Europe.
Marine gross trade per hub per quarter
Marine gross trade is calculated with the DWT of tanker vessels that loaded and discharged at a certain terminal. When we look closely at the marine gross trade trend and we compare that to the number of tanker visits, we are able to distinguish a similar trend as seen in figure 3 below.
Figure 3: Marine gross trade per hub per quarter; source TankTerminals.com
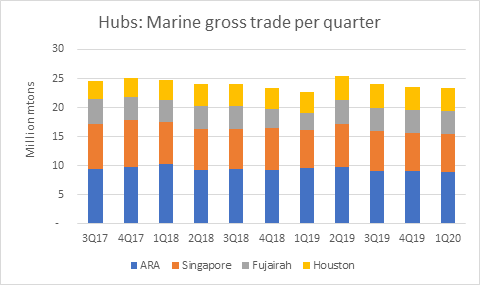
It is evident that the marine gross trade of the different hubs are more in line with each other. ARA accounts for 38%, Singapore 32%, Fujairah 18% and Houston 12% of the total sum of marine gross trade within these four regions. ARA is known for its intra- and inter- regional barge transports which contains lots of tanker visits with low volumes of product. Houston has a lot of push boat transports which are not included in this tool’s coding. Furthermore, we excluded Galveston and Beaumont area from the numbers.
Berth occupancy per hub per quarter
Berth occupancy rates per region show a diverse picture on a quarterly base. However, some sensible deduction can be derived from looking at the data. For the regions ARA, Singapore and Houston, the average berth occupancy rates per terminal show a rather stable picture per quarter with minimum values around 31-32% and maximum values around 34-35%. Fujairah has a relatively inconstant structure with a minimum value at around 29% and maximum value just below 40%.
Figure 4: Average berth occupancy per quarter; source TankTerminals.com
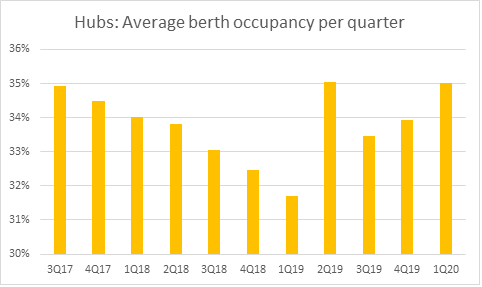
It is evident from the chart above that the average berth occupancy rate for all hubs combined is the second highest in the first quarter of 2020. Across all regions, the data implies that average berth occupancy in this quarter is far above the average value. The decreasing trend up to the first quarter of 2019 highlights the ‘wait-and-see’ attitude leading up to the IMO 2020 marine fuel implementation. The peak in berth occupancy rates in the second quarter of 2019 and subsequent increases in berth occupancy since then can be explained as terminal operators were preparing for IMO’s legislation that went into effect at the beginning of 2020.
Conclusion and what is next?
When looking at the statistics of tanker visit numbers, marine gross trade and average berth occupancy rates, it can be concluded that the main trading hubs show similar patterns, especially in the second quarter of 2020 in which the defining events OPEC+ conflict and COVID-19 evolved.
In the first quarter of 2020 the number of tanker visits of the different hubs was at a minimum while the average berth occupancy rates were at their second highest. The low number of tanker visits is likely to have been caused by 1) high fill rate, or almost full tanks of terminal operators due to contango storage play options and 2) lower consumption levels due to demand destruction by COVID-19.
The high berth occupancy rates can be explained that, despite the low number of tanker visits, in the first quarter of 2020 terminal operators were coping with the impact of COVID-19 to their business operations which might have resulted in a bit slower vessel handling at the terminals.
“Knowing how well your ships are performing is crucial during these uncertain times,” say Chris Aversano, Product Manager at Q88. He continues, “Our VMS system gives the owners peace-of-mind to make the right decision at the right time. Additionally, our Position List platform allows for brokers to better serve their clients in a highly competitive and continuously changing space.”
Jacob van den Berge, Marketing and Sales Manager at IG adds: “using different data sets, combining this with our own unique knowledge and expert knowledge of our partners such as Q88 has proven to offer unique market intelligence. This supports our relations in making justified commercial decisions.”
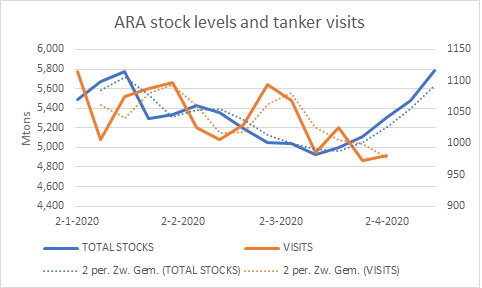
According to figure 5 below, when we focus in at the first quarter of 2020 and look at the tanker vessel visits in ARA on a weekly basis we see the number of tankers at terminal’s berths are all below this time series weekly average. If we than look at the ARA oil product stocks levels for the same time-period, we can actually see a buildup of stock levels since March 12. This in line when the lockdown measures that were initiated by the European governments.
Figure 5: ARA stock levels and tanker visits; source TankTerminals.com
Having access to accurate, up-to-date oil storage rates is crucial to make the right business decisions.
With our Global Oil Storage Rate Report, you’ll gain access to the single and only authoritative source of storage rate information available worldwide. It will provide you with transparency on price levels in global tank storage markets regularly, so you are always in the know and can set the right ask and bid prices for your storage.
Download your FREE Sample Report now and discover what information you could have at your fingertips each quarter.
About the authors
Chris Aversano, Q88, Office: +1 203 413 2030
Jacob van den Berge, Insights Global, Mobile: +31-6 28 34 87 84
Subscribe to our newsletter with the latest insights or contact us directly.