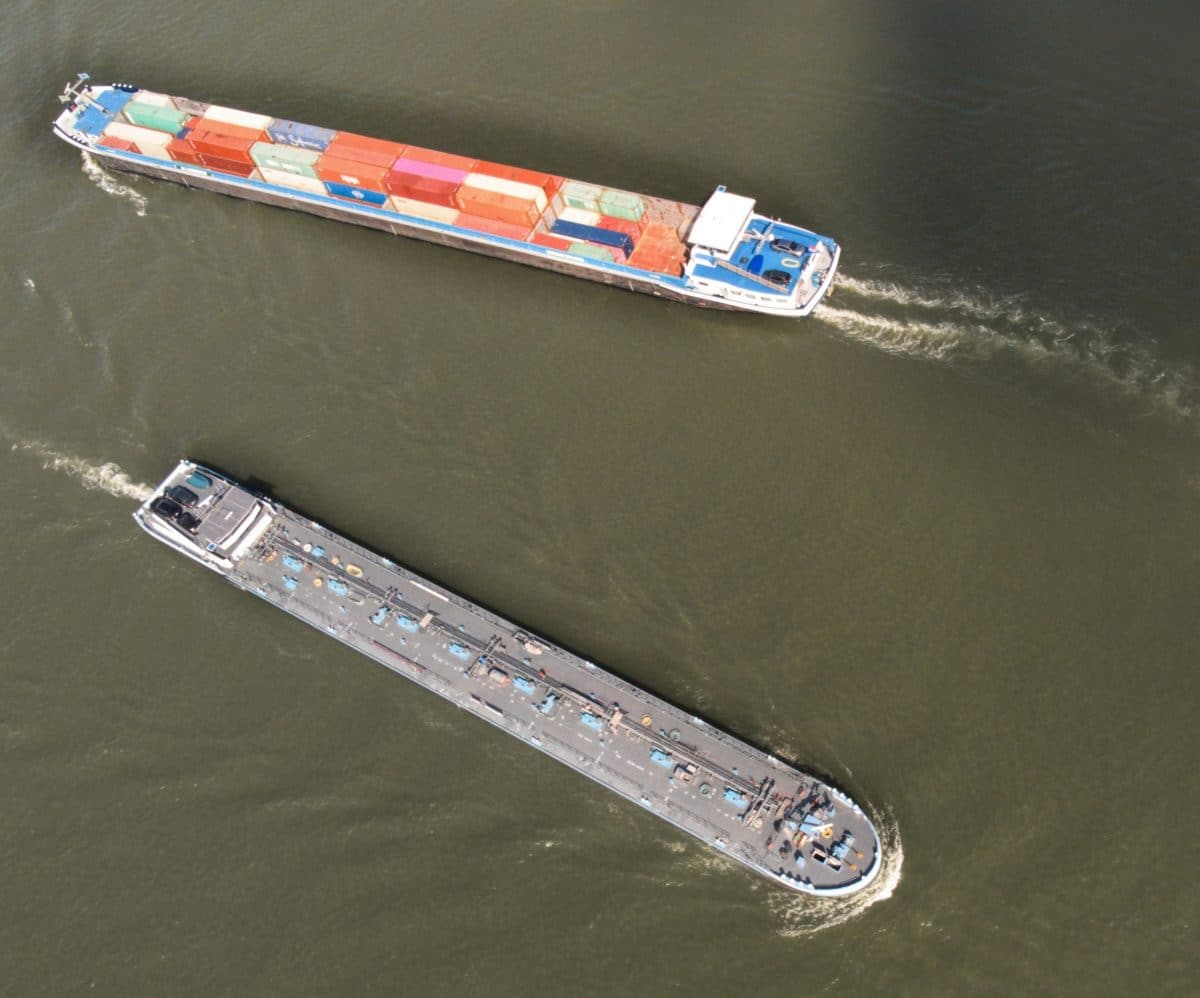

The ARA clean petroleum product (CPP) barge freight market ended the first full week of October on a strong note, with freight rates climbing steadily and spot volumes rebounding sharply. The combination of Rhine water level declines, terminal congestion, and month-end contract expiries fueled renewed demand for tonnage. The result was the busiest trading period in nearly two months.
1. Freight Rates: Upward Momentum Returns
Rates firmed across nearly all ARA routes during the week:
- Early week (3–7 October): Freight rates were initially flat to softer. Cross Harbor and main trunk routes (Rotterdam–Antwerp/Amsterdam) hovered around €1.20–€2.20/ton, with limited variation. On 7 October, rates slipped by €0.02–€0.10/ton as liquidity dried up and daily volume dropped below 30 ktons.
- Midweek (8 October): Rates stabilized, with minimal changes reported and operators describing the market as calm but balanced. Total volume was around 33 ktons.
- 9–10 October: A dramatic turnaround followed. On 9 October, rates surged by €0.05–€0.10 across most routes—Cross Harbor rose to €1.31, Rotterdam–Antwerp/Amsterdam to €2.27, and Antwerp–Amsterdam to €3.25, supported by rising demand and Rhine-linked shortages.
- The trend extended into 10 October, with another €0.05–€0.10 increase across all major routes. Total rates for Cross Harbor, Antwerp–Amsterdam, and Ghent–Amsterdam reached their highest levels since early August, averaging €1.34, €3.32, and €4.00/ton, respectively.
Takeaway: A strong end to the week reversed earlier weakness, confirming the first synchronized upward trend in ARA freight rates since midsummer.
2. Spot Volumes: From Multi-Week Lows to Near Record Highs
- On 3 October, volumes totaled 36.6 ktons, the lowest of the week, as freighters reported difficulty securing clients amid weak weekend demand.
- 6–8 October remained sluggish, with daily totals between 30–38 ktons, weighed down by slow spot inquiries and delays at ARA terminals.
- 9 October marked a dramatic rebound, with 81.9 ktons traded, more than doubling previous days’ volumes.
- By 10 October, the upward momentum peaked: nearly 93.4 ktons were recorded, the highest daily total since July, reflecting both operational congestion and Rhine-linked redistribution needs.
Takeaway: ARA spot activity surged late in the week, driven by Rhine constraints and delayed cargoes rolling forward into October loadings.
3. Product Trends: Broad-Based Strength but Distillates Lead
- Middle distillates dominated trading, accounting for most of the late-week rebound. On 9 October, distillate-related fixtures rose sharply as Rhine draft restrictions forced additional short-haul ARA deliveries.
- Light ends (gasoline and blending components) also improved but lagged slightly due to continued discharge delays at Amsterdam terminals. Despite this, Antwerp–Amsterdam and Flushing routes saw rate increases of up to €0.05/ton.
- By 10 October, the gap between product classes had narrowed, reflecting broad-based strength across all segments.
Takeaway: Distillate freight drove the rebound, but congestion-induced flexibility needs supported light ends as well.
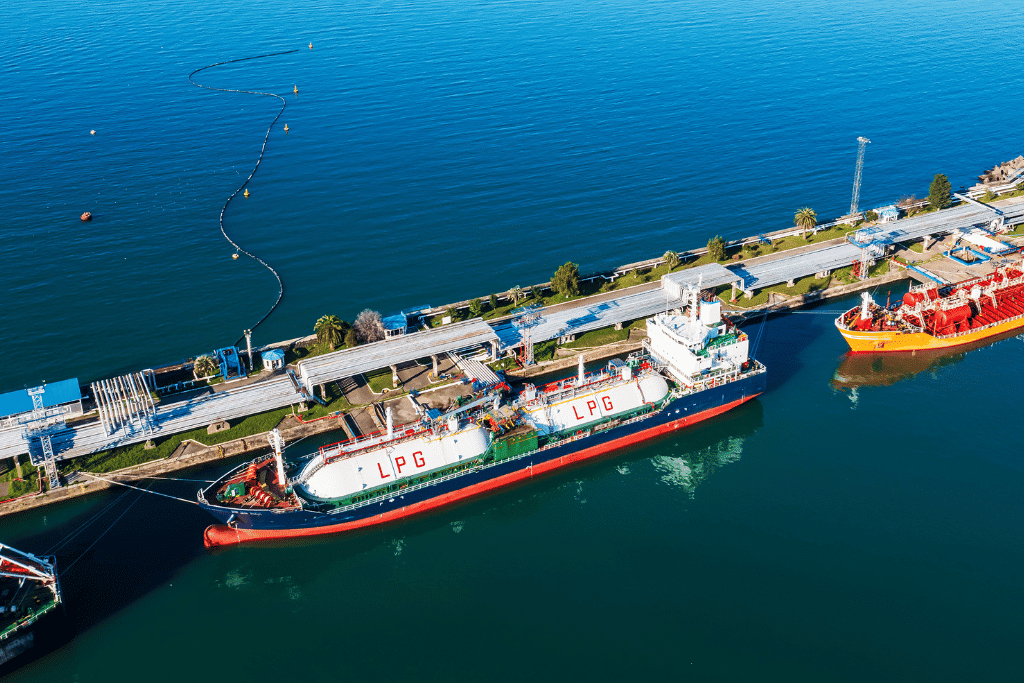
4. Operational Context: Congestion and Rhine Pull
- Persistent terminal delays in Amsterdam, especially at Evos East and West, continued to disrupt planning and tie up tonnage. Several vessels waited offshore for discharge slots through midweek.
- Falling Rhine water levels increased demand for smaller, shallow-draft barges to maintain inland supply, tightening barge availability in the ARA region. This effect intensified from 9 October onward, pulling vessels upriver.
- Meanwhile, the ICE Gasoil October expiry (settling at $669.75/ton on 10 October) further accelerated late-week barge activity, with traders clearing outstanding positions before contract rollover.
Takeaway: Logistical friction combined with Rhine-driven fleet redistribution to tighten supply and elevate ARA freight rates.
5. Market Outlook: Short-Term Firmness, Structural Caution
Looking forward:
- The near-term outlook remains firm, supported by ongoing Rhine restrictions and residual ARA congestion.
- However, underlying fundamentals—ample barge supply, muted downstream demand, and seasonal refinery transitions—are likely to cap the rally.
- Barring further hydrological deterioration, the ARA market may see rates plateau in the coming week.
Takeaway: The market’s newfound strength is likely short-lived, driven by logistics rather than lasting demand improvement.
Conclusion: Congestion-Fueled Revival
The ARA barge freight market between 3 and 10 October shifted sharply from inertia to intensity. Rates rose across all major corridors as spot demand rebounded, volumes surged, and logistical disruptions multiplied. Yet, the rally’s foundation remains fragile—anchored more in operational tightness and Rhine constraints than in underlying trade growth. Freight professionals should expect continued volatility as October unfolds.
What’s next?
Are you ready to face your challenges head-on?
We now offer a FREE customized trial to our BargeINSIGHTS tool, an all-in-one platform for liquid bulk barge transport optimization.
With BargeINSIGHTS, you get instant insights into barge freight rates, bunker gas oil prices, water levels, vessel tracking, and barge availability—all in one place. No more time-consuming data collection; everything you need is at your fingertips.
Click here to schedule your demo and get access to BargeINSIGHTS for free!