Investment Dynamics Per Hub

In the world, there are considered to be four major oil trading hubs: ARA, Houston, Singapore, Fujairah. These four port areas have their own different identity and their own local trading dynamics. In this high level research, we will compare investment intensity in these locations. For comparison purposes in ARA, we have split ARA in only Rotterdam and Antwerp.

In these 5 ports combined there are 146 terminal companies active. Most of the companies are situated in Houston (53), followed by Rotterdam (31), Antwerp (24), Singapore (21) and Fujairah (17). Looking at the capacity, these ports sum up to 76.35Mcbm. Most capacity is available in Houston (25Mcbm), followed by Rotterdam (19Mcbm), Singapore (15.28Mcbm), Fujairah (9.35Mcbm) and Antwerp (7.65Mcbm).

When we divided total storage capacity with the number of terminals we can calculate the average capacity per terminal. Biggest average tank size is in Singapore (0.73Mcbm), followed by Rotterdam (0.62Mcbm), Fujairah (0.55Mcbm), Houston (0.47Mcbm) and Antwerp (0.32Mcbm).

This calculation says something about the local storage footprint and the port’s specialty. For instance, Singapore is an Asian bunker hub which facilitates fuel oil storage. There are a number of big underground caverns there. Antwerp is focused on specialty chemical storage which need smaller tank sizes and lower average storage capacity per terminal.

For these five port areas, it is believed that around 22 expansions projects (existing greenfield, brownfield and planned additions) will add almost 8Mcbm to current capacity. Fujairah has 7 projects, followed by Houston (6), Antwerp (5), Singapore (3) and Rotterdam. Looking at the growth per capacity, port that shows the largest storage additions is Fujairah (29%), Antwerp (11%), Houston (9%), Rotterdam (7%) and Singapore (5%).

The conclusion of these statistics is that the major oil trading hubs have different strengths, serve a different purpose and show their own investment dynamics. Insights Global has presence at all these ports. We have the statistics and local knowledge to help investment companies value storage assets they would like to include in their investment portfolio.

Register For Your Download

Request Your ARA Stocks Trial

To ensure our market intelligence reporting meets and exceeds your business requirements before purchase, you are able to request a free 30 day trial.

Just leave your contact-details in the registration form below.

Note: we reserve the right to deny or withdraw trials for invalid details.

Relation barge flows & ARA stocks

Physical and futures oil trading companies struggle in getting a holistic view on the supply and demand balance of Northwest European oil markets. Changes in the S&D balance influence inventory levels and ultimately oil price movements. This incomplete picture results in sub-optimal market timing and more risks.

The Rhine Flow Service is the missing link in the ARA S&D puzzle as it captures oil products barge movements up and down the Rhine. Backtesting of Rhine Flow Service data in relation with ARA oil stock levels shows that there is a significant correlation between ARA stock levels and Rhine barge movements.

Register For Your Download

Request Your RFS Trial

banner-4

To ensure our market intelligence reporting meets and exceeds your business requirements before purchase, you are able to request a free 30 day trial.

Just leave your contact-details in the registration form below.

Note: we reserve the right to deny or withdraw trials for invalid details.

Two-days Oil Academy

Increase Your Value with More Knowledge

Numbers from EY (2015) show that in the Netherlands around 16.000 people were active in the oil and gas industry. In the same year in the United States some 1.5 million people were employed in this sector. The service providing companies are not even taken into account. It is a massive industry!

It is not only big in size but also in complexity. A lot of companies that we meet only partly understand the logistical oil and gas chain in which they are active. They lack the knowledge to oversee the entire supply chain. Specifically these other parts of the value chain have a direct impact on their business.

Several companies have followed our two-days Oil Academy. After these days they are capable in understanding the functions of the oil and gas value chain. They understand better how the different market players work and how market fundamentals interact. More than 200 participants preceded you and rated this course with an 8!

For more information, request our Oil Academy brochure by registering in below’s form.

Investment dynamics vary per major trading hub

In the world, there are considered to be four major oil trading hubs: ARA, Singapore, Fujairah. These four port areas have their own different identity and their own local trading dynamics. In this high level research, we will compare investment intensity in these locations. For comparison purposes in ARA, we have split ARA in only Rotterdam and Antwerp.

In these 5 ports combined there are 146 terminal companies active. Most of the companies are situated in Houston (53), followed by Rotterdam (31), Antwerp (24), Singapore (21) and Fujairah (17). Looking at the capacity, these ports sum up to 76.35Mcbm. Most capacity is available in Houston (25Mcbm), followed by Rotterdam (19Mcbm), Singapore (15.28Mcbm), Fujairah (9.35Mcbm) and Antwerp (7.65Mcbm).

When we divided total storage capacity with the number of terminals we can calculate the average capacity per terminal. Biggest average tank size is in Singapore (0.73Mcbm), followed by Rotterdam (0.62Mcbm), Fujairah (0.55Mcbm), Houston (0.47Mcbm) and Antwerp (0.32Mcbm).

This calculation says something about the local storage footprint and the port’s specialty. For instance, Singapore is an Asian bunker hub which facilitates fuel oil storage. There are a number of big underground caverns there. Antwerp is focused on specialty chemical storage which need smaller tank sizes and lower average storage capacity per terminal.

For these five port areas, it is believed that around 22 expansions projects (existing greenfield, brownfield and planned additions) will add almost 8kcbm to current capacity. Fujairah has 7 projects, followed by Houston (6), Antwerp (5), Singapore (3) and Rotterdam. Looking at the growth per capacity, port that shows the largest storage additions is Fujairah (29%), Antwerp (11%), Houston (9%), Rotterdam (7%) and Singapore (5%).

The conclusion of these statistics is that the major oil trading hubs have different strengths, serve a different purpose and show their own investment dynamics. Insights Global has presence at all these ports. We have the statistics and local knowledge to help investment companies value storage assets they would like to include in their investment portfolio.

Jacob van den Berge, M&S manager Insights Global

What technology area do you expect to be a game-changer?

Welcome to “GRIPPING THOUGHTS”, the space created by Insights Global where Clients, Partners and Friends are invited to share ideas and insights that help shedding light on the challenges that the Oil & Gas industry faces, in the near and long future.

So join us and get inspired by IVAR BERNTZ, Research Analyst in the Cross-Industry and Advanced Manufacturing Group at GARTNER :

“Gartner recently released the results of their 2019 CIO Survey Oil and Gast Industry insights , based on 84 responses out of the 3,102 overall respondents from 89 countries. Let us discuss two of the questions posed, namely: 1) What is your organization’s top priority for 2018/2019? and 2) What technology area do you expect to be a game-changer for your organization?

Through 2018 oil and gas firms have made continued significant progress improving efficiency. With improving balance sheets and leaner operations, it is unsurprising that oil and gas executives are strongly focused on revenue and business growth as their top priority, as stated by 28% of the respondents. Caution, however, is still in evidence since the recovery is recent and market conditions remain volatile. Operational excellence  provides a relatively low-risk route to growth and profitability and is the priority for 26% of respondents.

Oil and gas company executives, senior leaders and functional managers are embracing digital. This year 22% of survey respondents rated it as top priority, compared with only 8% last year. Recognition of the capacity of digital innovation to both optimize and transform business models has crossed a tipping point in the industry, significantly elevating digital as a priority. Nevertheless, companies in most other industries are more likely to prioritize digital, a sign that traditional oil and gas industry inertia has not disappeared. Progress may be rapid by oil and gas standards but is only just keeping pace with trends outside the industry.

The oil and gas industry’s striking enthusiasm for analytics continues unabated, with 44% of oil and gas CIOs expecting data analytics to be the top game-changing technology  for the industry this year — double the percentage across  industries. Despite occasional mixed results and scepticism of vendor promises, analytics has gained widespread acceptance based on multiplying use cases and demonstrated value. As digital ambitions intensify, analytics is consistently prioritized by oil and gas leadership seeking proven ways to derive business value from digital technologies.

The greatly elevated priority of the IoT is new, with 24% of respondents now identifying it as a game-changing technology compared to 8% last year. As companies deal with existing inefficiencies, continued pursuit of operational excellence demands new strategies to improve asset performance, driving greater use of analytics for simulation and prediction of future behaviour. Analytics’ focus also shifts from reactive modelling offline to nearer real time. IoT offers advantages in data collection and system responsiveness over legacy systems to support this. However, cost-benefit considerations have so far acted as a brake on adoption, especially on mature assets. With renewed business growth the comparative advantages (and increasing cost-effectiveness) of IoT promise performance differentiation that will accelerate take-up.

A stark difference between oil and gas and all industries is apparent in artificial intelligence/machine learning. Across all industries, artificial intelligence/machine learning is ranked as the No. 1 game-changing technology across all three categories of performers, with 40% of top performers placing it at the top. While it is the third-most-cited, game-changing technology in oil and gas, only 21% of industry CIOs rate it as the top technology.

In part, this reflects the natural mistrust of the industry to hyped technology. Many oil and gas operators are still exploring ML and AI use cases and have yet to operationalize it. Understanding is more concrete for other technologies today, which — given the asset-centric nature of the business — are also expected to deliver significant value leading to a more even spread of expectation. Nevertheless, the growth of AI and ML, along with the elevation of IoT, indicates a shift in focus in the industry toward greater real-time connectivity and prediction for asset optimization.

Given this background, what do you believe will be your organization’s top priority for 2019 and what technology will be a game changer to accomplish it?”

PS: if you want to contribute to “Gripping Thoughts” please send an email to acavalcanti@insights-global.com
Find here other “Gripping Thoughts” articles:

Read now the interview with Bertrand Chupin, VP of the Loading Systems business unit of TechnipFMC, a global leader in subsea, onshore/offshore and surface projects, with about 37,000 employees.

Profit drivers for physical traders

INTRODUCTION

This is the second blog article of our series of 5 blog articles made for you to be able to better understand the drivers and the complexity of the tank storage industry. In the first article we took a closer look at the functions of a tank terminal.

HOW DO TRADERS MAKE MONEY?

Traders can take a physical (&paper) position and ‘buy low / sell high’ to be able to make profit. There are several strategies to profit from trading physical commodities. We can distinguish three main strategies:

1.Arbitrage
2.Speculation
3.Optionality

ARBITRAGE

Arbitrage is a very simple idea, it is really taking advantage in the difference of price on essentially the same product, to make profit. For example if you would have the price of gasoline in two different geographical markets. These different markets can be the Netherlands (A) and the US (B). If in market A the price would 1 dollar and in market B the price would be 2 dollars, then you can profit from the difference in price. The three main types of arbitrage are:

1.Geographical arbitrage
2.Time arbitrage
3.Technical arbitrage (blending)

SPECULATION

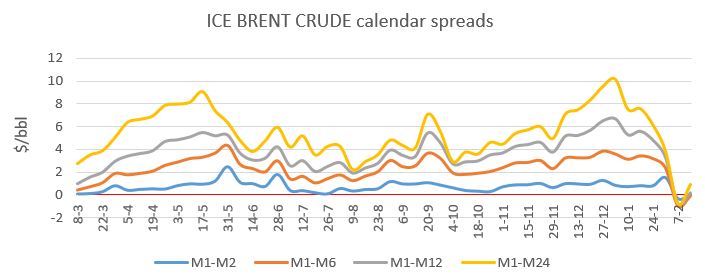
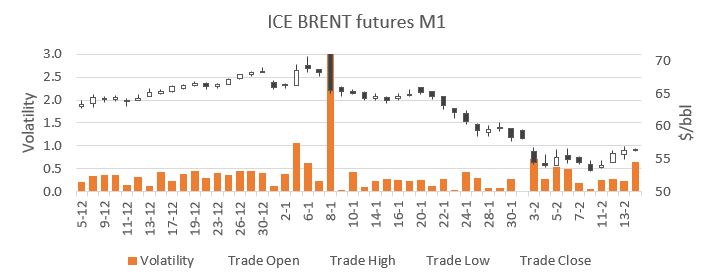
The U.S. Commodities Future Trading Commission defines a speculator as a trader who does not hedge, but who trades with the objective of achieving profits through the successful anticipation of price movements. Traders take a position in anticipation of moves in prices/spreads. For example with the gasoil price as is shown in the chart below:

OPTIONALITY

As for speculation, also for optionality volatility is key. Profit can come from market opportunities, where traders can limit losses if market turns against position. Three examples are:

  • Optionality during geographic arbitrage trade. For example divert ship if there is a better deal and reduce costs
  • Optionality during contango storage. Contango means that the spot price of oil is lower than future contract for oil
  • Optionality in transport mode. Can be applied when transport costs are market driven and volatile

CONCLUSION

More familiarity within this complex market can provide you with quick insights derived from the financial markets. By watching and following oil prices spreads and market volatility can provide you with a better picture of the market. Other trends like backwardation and contango are also important to understand and analyse, to be able to make intelligent decisions. More to come in the next blog article next week, meanwhile feel free to download last week’s tank terminal report. And try to test your comprehension of the subjects discussed.
For more information or any questions please do not hesitate to contact us.