Just a few years ago the head of ExxonMobil had to appear before a Congressional committee to explain their billions of dollars in profits that some called “obscene.”
This week investors in ExxonMobil are asking why the company did not make any profit during the first quarter of 2020. Its $610 million loss is the first time that ExxonMobil reported a loss in more than 30 years.
ExxonMobil isn’t the only oil company reporting financial troubles. Actually, there are more losers than winners.
The United States Oil Fund, the largest crude exchange traded product, said recently it will sell all of its 30-day contracts to avoid a repeat of the heavy losses that occurred around the expiration of the May contract on April 20 when the price of oil bottomed out at -$37 per barrel.
Crude oil inventories continue to rise indicating the oversupply is still expanding. The Energy Information Administration reported on Wednesday inventories increased by 4.6 million barrels from 527 million barrels to 532 million barrels. It is the 14th consecutive week that inventories increased.
Oil prices on the New York Mercantile Exchange for June delivery increased early in the week to $25 but declined to $23 after inventory figures were announced. Posted price for lease sales in Texas varied from $21 in North and West Central to $14 in South Texas, according to the Texas Alliance of Energy Producers web page.
The S&P Dow Jones Indices announced last week it would “pre-roll” all June West Texas Intermediate contracts to July for all of its commodity indices given the risk of June falling to or below zero given limited storage capacity.
Even though many U.S. oil producers intend to cut their production, it takes time to work out the details. Which wells will be cut back? Can they be shut down entirely? What’s the cost? Will there be damage to the well? What problems could be encountered restarting production? What about contracts with partners, royalty owners, drilling contractors and other service providers?
The EIA reports that U.S. production has dropped since a high of 13.1 million barrels per day in February to 12.8 this week. ExxonMobil, Chevron and ConocoPhillips all say they will reduce production that will total about 1.2 million b/d this year.
Many companies that purchase crude oil at the lease from smaller independent producers have told their customers they will not purchase any oil after May 15 because storage facilities are near capacity and there is no place to store the oil.
Refinery run fell to 12.8 million b/d for the week ending April 24, which is 21 percent lower than the five-year average. Demand for gasoline and jet fuel dropped to a 30-year low and an oversupply exists. Retail gasoline prices across the U.S. averaged $1.789 per gallon last week, which is a decline of $1.108 from the same period in 2019 …
The U.S. rig count declined by 57 last week to 408. The rig count last year on May 1 was 990. The huge decline indicates that producers will have difficulty replacing reserves and production when prices rebound.
There is a light at the end of the tunnel, however. Economists expect demand for petroleum products will strengthen as economic activity increases following the easing to restrictions on travel and business activity.
Will ExxonMobil be able to survive? Time will tell. As the global economy rebounds so will the demand for petroleum products and the bottom line for oil producers in Texas and around the world.
The COVID-19 virus has a huge impact on the global oil market. The virus and the economic crisis it evoked results in a large decline of the oil demand. I this article we will describe the consequences of this drop in consumption on the tanks storage demand in main oil hubs.
A collaboration between Q88 and Insights Global, updated version
In the world of the liquid storage some 5,000 terminals can be identified. These terminals have different kind of functions. A terminal’s main function is to balance supply with demand, they can act as import terminal, as trading platform or offer strategic storage options.
Q88 and Insights Global are proud to partner to bring our clients timely information. Never before has the relevance of these terminals been highlighted, and in this article we will analyze the recent confluence of events including 1) super contango due to OPEC+ conflict and 2) demand destruction due to the COVID-19 crisis, impact tanker vessel visits, and berth occupancy at the four major trading hubs.
In the international oil and petrochemical market four main trading and storage hubs can be distinguished: ARA (Amsterdam-Rotterdam-Antwerp), Houston, Singapore and United Arab Emirates (UAE). Due to their large consuming backyard, their refinery infrastructure base and presence of a trading or financial industry, these hubs have become dominant regions in this trading industry.
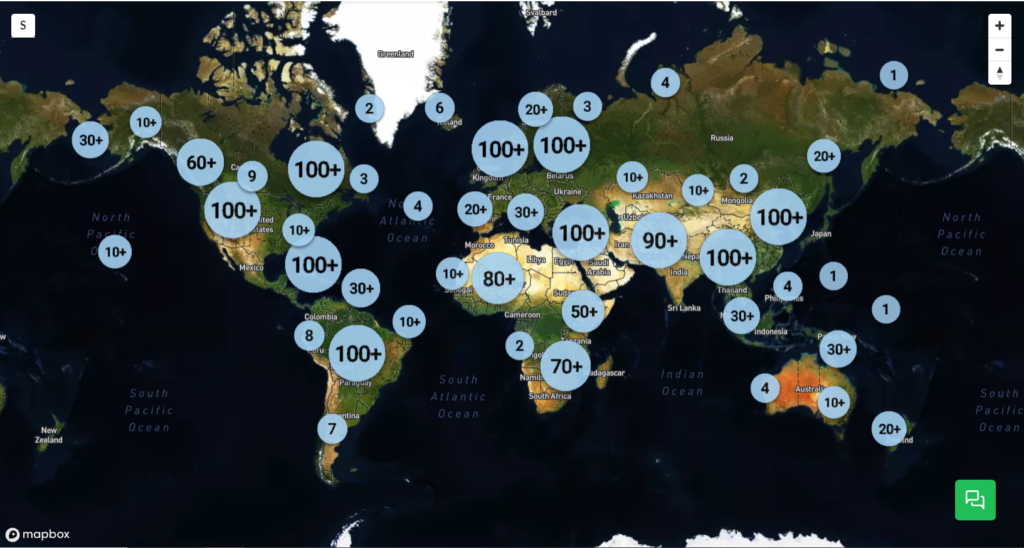
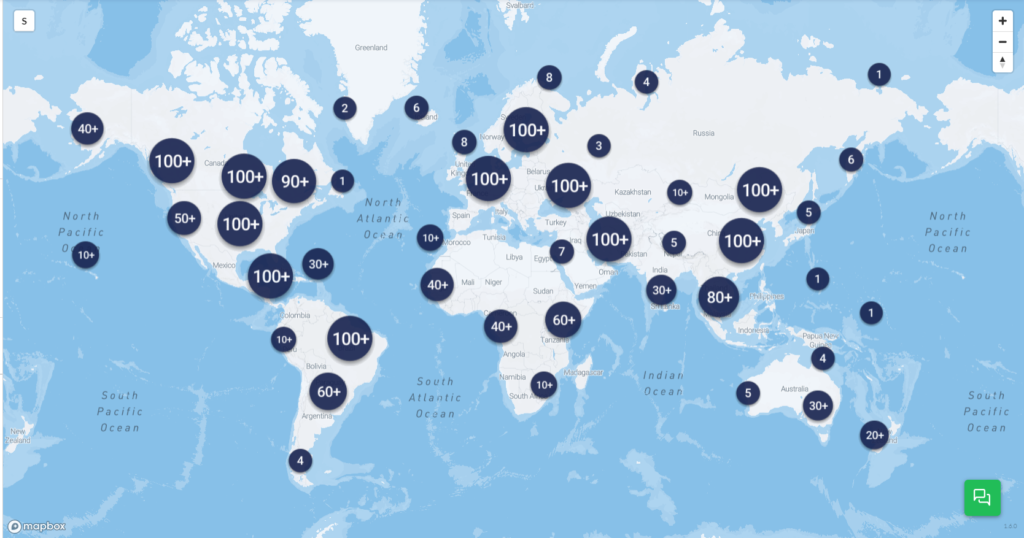
Figure 1: Location of tank terminals around the globe; source TankTerminals.com
More details of the key trading hubs
The ARA consist of 68 terminals with a total capacity of around 36Mcbm. From these terminals, 65 terminals are marine terminals. Based on capacity the most dominant player is Vopak (9.2Mcbm) followed by Koole (3.5Mcbm), VTTI (3.2Mcbm) and Oiltanking (3.2Mcbm).
The port of Houston has 52 terminals with a capacity of approximately 29Mcbm. Main players are Kinder Morgan (6.3Mcbm), Enterprise Products (4.7Mcbm) and Magellan Midstream (4.2Mcbm). Of these terminals, 35 terminals have barge access and 24 terminals have sea access.
Singapore has 21 terminals with a total capacity of 16Mcbm. The biggest storage player in this area is Vopak (3.3Mcbm), followed by Oiltanking (2.5Mcbm) and Universal Group (2.3Mcbm).
The UEA consists of 61 terminals with a capacity of 18.5Mcbm. 20 of these terminals have sea access and 11 have barge access. The most dominant storage player is Vopak (2.6Mcbm), ADNOC (2.3Mcbm) and Horizon Terminals (1.7Mcbm). All these terminals are marine terminals.
“When deep-diving the global tank storage market and specific areas, it absolutely essential to understand how many storage capacity there is, how many players are active and what their position is”, according to Jacob van den Berge, Marketing and Sales Manager at IG. “This is the first step in defining the competitive landscape of the industry.”
Major events and their impact on storage demand further explained
Super contango due to OPEC+ conflict
What is contango? A contango is a situation where the price of front month oil futures is lower than oil with future delivery. If the spread between these prices is large enough to cover storage, finance and shipping costs, a trader is able to make a profit by buying oil now and selling it on the futures market for a later delivery. However, in order to capitalize on this profit, a trader needs storage (and transport) capacity. That is what happened in the first quarter of 2020 with massive demand for storage in ARA and the other key trading hubs resulting in high occupancy rates, putting a premium on free tank capacity now.
As the contango market structure persists and there is a lack of onshore storage facilities, traders are turning to tanker vessels to store their precious hydrocarbons.
This situation was heightened when Russia and Saudi Arabia could not come to terms regarding the height of production cuts to stabilize the fall in oil prices and Russia stepped out of the OPEC+ alliance. This resulted in Saudi Arabia offering its crude with huge discounts to its international customers, which triggered a free fall of oil prices and resulted in a super contango.
The recent peace between these two top producing countries and the subsequent OPEC+ deal has only reduced the speed of oil prices declining. The recent negative WTI oil prices show that we are far from balancing the market.
“Having an understanding of these key issues is imperative while calculating potential earnings,” says Chris Aversano, Product Manager at Q88.com. He continues, “Many of our products have earnings estimators that are built-in, giving our clients a greater understanding of the marketplace.”
Demand destructive impact of COVID-19
As we know, Coronavirus originated from China, and initially affected only China and its enormous economy. However, as the virus spread, different government lockdown interventions were initiated and economies came to a standstill. Less consumption, less production, less trade and less investments caused demand to be reduced significantly, all occurring in the first quarter of 2020.
A new feature in TankTerminals.com, called the Logistical Performance Benchmarking add-on, enables us to see what’s going on at terminals on a weekly basis. Amongst others, we can look at the activity levels at tank terminals.
So what did the numbers at the terminals of these major trading hubs show? Is there any impact of the super contango and COVID-19 crisis visible?
Putting It All Together
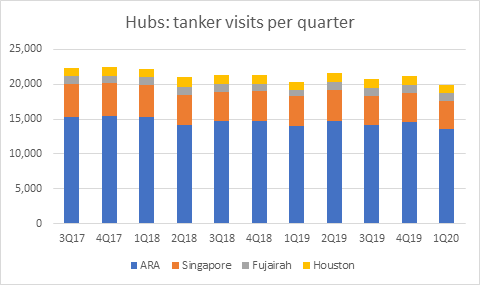
Tanker visits per hub per quarter
In figure 2 it can be seen that the number of tanker vessels visits at the marine terminals of the different hubs, ARA and Singapore show a similar pattern as applies for Fujairah and Houston. For ARA and Singapore applies that the peak of the visits were at the end of 2017 and the least visits in the first quarter of 2020. For Houston and Fujairah applies that highest number of tanker visits was in the second quarter of 2018 while the lowest number of tanker visits were seen in the first quarter of 2019.
Figure 2: Tanker visits per hub per quarter; source TankTerminals.com
The maximum value in ARA was 15405 tanker visits and the minimum value with 13591. In Singapore, the maximum value was 4756 and the minimum value was 3956. For Fujairah the maximum value was 1196 and the minimum value was 878. The maximum value in Houston was 1372 and the minimum value was 1153. As can be derived from the number of tanker visits, the ARA region accounts of almost 68% of all tanker visits of these four hubs combined. This is because of the extensive use of tanker barges and coasters in this area to distribute products within Europe.
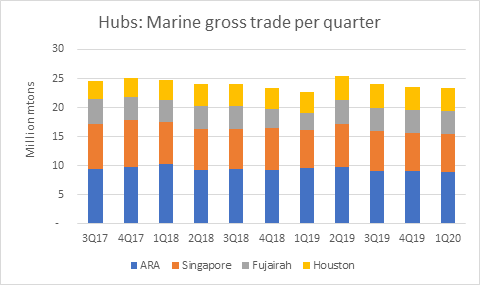
Marine gross trade per hub per quarter
Marine gross trade is calculated with the DWT of tanker vessels that loaded and discharged at a certain terminal. When we look closely at the marine gross trade trend and we compare that to the number of tanker visits, we are able to distinguish a similar trend as seen in figure 3 below.
Figure 3: Marine gross trade per hub per quarter; source TankTerminals.com
It is evident that the marine gross trade of the different hubs are more in line with each other. ARA accounts for 38%, Singapore 32%, Fujairah 18% and Houston 12% of the total sum of marine gross trade within these four regions. ARA is known for its intra- and inter- regional barge transports which contains lots of tanker visits with low volumes of product. Houston has a lot of push boat transports which are not included in this tool’s coding. Furthermore, we excluded Galveston and Beaumont area from the numbers.
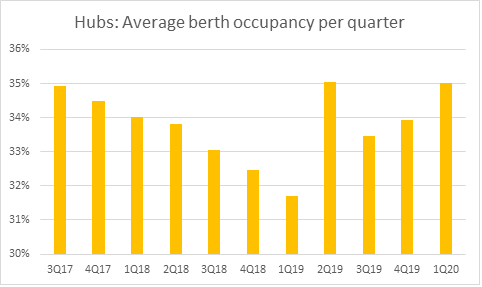
Berth occupancy per hub per quarter
Berth occupancy rates per region show a diverse picture on a quarterly base. However, some sensible deduction can be derived from looking at the data. For the regions ARA, Singapore and Houston, the average berth occupancy rates per terminal show a rather stable picture per quarter with minimum values around 31-32% and maximum values around 34-35%. Fujairah has a relatively inconstant structure with a minimum value at around 29% and maximum value just below 40%.
Figure 4: Average berth occupancy per quarter; source TankTerminals.com
It is evident from the chart above that the average berth occupancy rate for all hubs combined is the second highest in the first quarter of 2020. Across all regions, the data implies that average berth occupancy in this quarter is far above the average value. The decreasing trend up to the first quarter of 2019 highlights the ‘wait-and-see’ attitude leading up to the IMO 2020 marine fuel implementation. The peak in berth occupancy rates in the second quarter of 2019 and subsequent increases in berth occupancy since then can be explained as terminal operators were preparing for IMO’s legislation that went into effect at the beginning of 2020.
Conclusion and what is next?
When looking at the statistics of tanker visit numbers, marine gross trade and average berth occupancy rates, it can be concluded that the main trading hubs show similar patterns, especially in the second quarter of 2020 in which the defining events OPEC+ conflict and COVID-19 evolved.
In the first quarter of 2020 the number of tanker visits of the different hubs was at a minimum while the average berth occupancy rates were at their second highest. The low number of tanker visits is likely to have been caused by 1) high fill rate, or almost full tanks of terminal operators due to contango storage play options and 2) lower consumption levels due to demand destruction by COVID-19.
The high berth occupancy rates can be explained that, despite the low number of tanker visits, in the first quarter of 2020 terminal operators were coping with the impact of COVID-19 to their business operations which might have resulted in a bit slower vessel handling at the terminals.
“Knowing how well your ships are performing is crucial during these uncertain times,” say Chris Aversano, Product Manager at Q88. He continues, “Our VMS system gives the owners peace-of-mind to make the right decision at the right time. Additionally, our Position List platform allows for brokers to better serve their clients in a highly competitive and continuously changing space.”
Jacob van den Berge, Marketing and Sales Manager at IG adds: “using different data sets, combining this with our own unique knowledge and expert knowledge of our partners such as Q88 has proven to offer unique market intelligence. This supports our relations in making justified commercial decisions.”
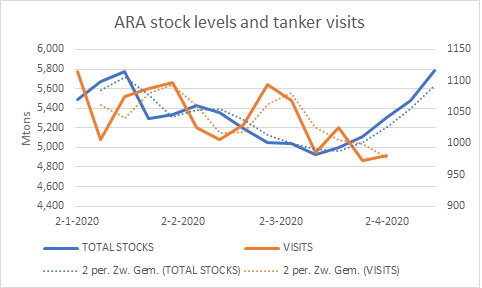
According to figure 5 below, when we focus in at the first quarter of 2020 and look at the tanker vessel visits in ARA on a weekly basis we see the number of tankers at terminal’s berths are all below this time series weekly average. If we than look at the ARA oil product stocks levels for the same time-period, we can actually see a buildup of stock levels since March 12. This in line when the lockdown measures that were initiated by the European governments.
Figure 5: ARA stock levels and tanker visits; source TankTerminals.com
Having access to accurate, up-to-date oil storage rates is crucial to make the right business decisions.
With our Global Oil Storage Rate Report, you’ll gain access to the single and only authoritative source of storage rate information available worldwide. It will provide you with transparency on price levels in global tank storage markets regularly, so you are always in the know and can set the right ask and bid prices for your storage.
Download your FREE Sample Report now and discover what information you could have at your fingertips each quarter.
In the world of international tank storage, thousands of terminals give access to commercial storage. These terminals are located all over the world. From large tank farms in oil trading hubs in ARA, USGC, Fujairah and Singapore to small depots on Guam or Greenland.
The tank storage sector is not a static industry but a dynamic one which grows every year. It is interesting to find out which regions have the most investments planned or are currently building new additions.
In picture 1 can be seen where the largest concentrations of tank terminals are.
The world’s hottest storage hotspots
Estimates are that global tank storage capacity will grow 8% to 1.03 billion cbm in 2020 and even 11.5% to 1.06 billion cbm in 2021.
When ranking the regions with the largest total tank capacity in 2019 the following list can be produced: 1) Asia (360Mcbm), 2) Europe (235Mcbm), 3) North America (191Mcbm), 4) Middle East (50.8Mcbm), 5) South America (45.5Mcbm), 6) Africa (43.6Mcbm), and 7) Oceania (4.4Mcbm).
In 2020 the ranking is as followed: 1) Asia (383.7Mcbm), 2) Europe (244Mcbm), 3) North America (207Mcbm), 4) Middle East (93.3Mcbm), 5) Africa (48.9Mcbm), 6) South America (47.8Mcbm), and 7) Oceania (4.7Mcbm).
Analyzing this list some remarkable conclusion can be taken:
-The Middle East will show the strongest growth rate with 84% in 2020 as capacity in this regions grows from 50.8Mcbm to 93.3Mcbm;
-Africa will leapfrog South America and take position 5. This continent shows a growth rate of 12%. Storage capacity increases from 43.6Mcbm to 48.9Mcbm.
-Europe will grow by 4% till 2020 and is the slowest growing region of all the 7 regions. Capacity in this region grows from 235Mcb to 244Mcbm
Although, looking at regions is sort of looking at it as from a macro-level perspective, we can well say that the Middle East will be the hottest tank terminal location in 2020. There are some interesting locations in the Middle East that have a substantial part in the additions in this region.
Fast growing areas in the Middle East
Oman Tank Terminal in Raz Markaz
In Oman storage of oil liquids is concentrated around the ports of Salalah, around Oman’s capital Muscat and Sohar’s industrial area. Oman’s government owned investment company OOC, Oman Oil Company announced a major investment in 2012 on building a massive 31Mcbm crude storage facility in Ras Markaz. Some 200 tanks will be added. Estimates are that this terminal will be operational as from June 2019. With this investment Oman is trying to develop its position as an important global trading and storage hub.
South Oil Company in Iraq
Roughly said, Iraq has storage facilities in its oil fields in the North, around Kirkuk, Al Anbar and Erbil and in the South, around Basrah. Most of these terminals are controlled by the Ministry of Oil of the Republic of Iraq. Government-owned South Oil Company will add 2.78Mcbm of crude capacity in Al Zubair and another 0.464Mcbm in Fao. For the first addition applies that some 489 crude tanks will be built. December 2019 has been pointed as data of operation. For the latter, applies that 5 tanks will be built and this expansion is planned to become operational in December 2020.
Jask Oil Terminal in Iran
In Iran, storage facilities are controlled by state-owned Iranian Oil Terminals CO. These terminals are mostly located at the Persian Gulf and the gulf of Oman, connected with each-other by the infamous Strait of Hormuz. Not in the 2019 and 2020 numbers but definitely worth mentioning is the 10Mcbm crude addition in Jask. Jask is peninsula that runs into the Gulf of Oman. The Jask Oil Terminal will include 20 tanks with floating roofs. he terminal will also include loading and unloading wharves, offshore facilities including three single-point mooring (SPM), and other infrastructure for import/export oil. Estimates are that this addition will be active in December 2021.
The data for this article was gathered with the support of tankterminals.com’s database platform. With only a few clicks and couple of seconds the information of the biggest market players in the various regions was obtained.
For more information, contact: Jacob van den Berge, Head of Marketing & Sales Insights Global
Provaris Energy and Norwegian Hydrogen AS have announced a new agreement to jointly progress the identification and development of several sites in the Nordic region for the large-scale production and export of hydrogen to European markets.
The projects will utilize locally available renewable energy to produce hydrogen for shipment to European ports. This will assist energy-intensive industries in making an impact on their decarbonization plans and target a scale and level of innovation that aligns with various European Union funding schemes.
New projects will be strategically located in areas with robust grid connections and power supplies. These sites will facilitate the construction of electrolyzers and hydrogen compression facilities linked to export jetties. Provaris’ H2Neo carriers will transport the hydrogen, while the H2Leo barge will serve as storage.
The initiatives will foster circular economies by utilizing by-products like clean oxygen and waste heat in local industries and district heating systems.
Jens Berge, Norwegian Hydrogen’s CEO, commented: “While we develop a comprehensive network of production sites and distribution infrastructure across the entire Nordic region, to reduce emissions in the Nordics, we have also identified several sites with significant export potential. While such locations could also be used to produce other derivatives such as e-methanol or green ammonia, we strongly believe that if the end demand is for gaseous hydrogen, nothing would be better than to avoid going via a derivative solely for transportation purposes. Provaris’ technology makes it possible to bring hydrogen in gaseous form all the way from production in the Nordics to the customers in continental Europe.”
In 2024, the partnership will select sites for further pre-feasibility studies, focusing on hydrogen production and export logistics, including safety, environmental, and regulatory aspects. Provaris is also advancing its H2Neo carrier, with ongoing prototype testing in Norway aimed at final construction approvals by mid-2024.
The IEA has released its first forecast for 2025 which shows global oil demand growth slowing to 1.15mn b/d next year — some 700,000 b/d lower than Opec’s latest projection.
In its latest Oil Market Report (OMR), the Paris-based agency also lowered its oil demand growth forecast for this year by 130,000 b/d to 1.2mn b/d, citing lower heating fuel use and a protracted factory slump in advanced economies.
The 2024-25 figures contrast sharply with 2022 when the global economy’s emergence from the Covid-19 pandemic led to a demand increase of 2.25mn b/d — something the IEA said had now largely run its course.
“Despite the deceleration that is forecast, this level of oil demand growth remains largely in line with the pre-Covid trend,” it said. The IEA also reiterated its view that a peak in oil consumption is in sight this decade, although it notes that without an increased investment push into clean energy technologies, “the decline in global oil demand following the peak will not be a steep one”.
The IEA said its 2025 forecast reflects a “somewhat sub-par economic outlook” and included vehicle efficiencies and an expanding electric vehicle (EV) fleet acting as “further drags on oil consumption.”
China, which has led much of the world’s oil demand growth over the past few decades, is slowing down, according to the IEA. The agency lowered its 2024 forecast for Chinese oil demand growth by 80,000 b/d to 540,000 b/d, falling to 330,000 b/d in 2025, although China still remains the single largest contributor to global growth next year.
The IEA’s latest forecasts continue to reflect stark differences with Opec in the way they see oil demand unfolding over the years and decades ahead. Opec sees oil demand growth substantially higher at 2.25mn b/d in 2024 and 1.85mn b/d in 2025.
On global oil supply, the IEA nudged down its 2024 growth estimate by 30,000 b/d to 770,000 b/d. While non-Opec+ production is projected to expand by 1.6mn b/d, this is partially offset by an 820,000 b/d forecast fall from Opec+ — assuming the group’s latest voluntary cuts remain in place until the end of the year.
Relentless oil supply growth from outside Opec+ is set to continue putting pressure on the alliance to keep production lower for longer. The IEA said that additional production from the US, Brazil, Guyana and Canada “alone could come close to meeting world oil demand growth for this year and next.”
The IEA’s latest supply forecast assumes Opec+ voluntary cuts remain in place until the end of 2024, which would keep the market in a deficit of 270,000 b/d, it estimates. Opec+ has yet to decide on its output policy for the second half of the year and may do so at a ministerial meeting scheduled for 1 June in Vienna.
Global observed oil stocks increased by 43.3mn bl to a seven-month high in February, despite a further 24.6mn bl decline in on land stocks, the IEA said. Oil on water rose to a “sizeable” 67.8mn bl in February, driven by shipping disruptions in the Red Sea that have forced vessels to take the longer alternate route around the southern tip of Africa.
In recent years, the production of renewable diesel and sustainable aviation fuels from biological sources, particularly natural oils, has experienced remarkable growth. This surge is largely driven by global climate change initiatives mandated by governments worldwide, coupled with the increasing emphasis on carbon capture and sequestration. As a result, substantial investments have been made in retrofitting and adapting existing refinery hydroprocessing infrastructure to accommodate natural oils or blends of natural oils with crude oil, facilitating the production of RD and SAF.
The rationale behind these investments lies in the molecular compatibility of natural oils with mid-distillate fuel products like diesel and aviation fuel, as well as the optimization of hydroprocessing units for the removal of unwanted sulfur and oxygen compounds. In modified hydroprocessing applications, the high-temperature decomposition of triglycerides leads to the production of RD and SAF through the hydroprocessing of esters and free fatty acids. The resulting oxygen-free RD and SAF products are fully interchangeable with petroleum hydrocarbons.
However, hydroprocessing of refined natural oils presents its own set of challenges, particularly in terms of corrosion. To address this issue, the authors have developed a molecular mechanistic model to quantify simultaneous high-temperature corrosion caused by naphthenic acids and sulfidation in refinery operations. This model, known as CorrExpert®-Crude, has been adapted to address high-temperature FFA corrosion, given the similarities between FFA and naphthenic acids.
A crucial aspect of modelling corrosion for FFA is understanding the inhibitive role of hydrogen in the presence of iron sulphide species. Although natural oils do not contain sulphur compounds, reactive sulphur species present in coprocessing applications facilitate the formation of a potentially protective nano barrier layer of iron sulphide. Additionally, FeS acts as a catalyst for the reduction of FFA through atomic hydrogen, generated from the dissociation of molecular hydrogen.
The prediction model incorporates factors such as hydrogen partial pressure, residence time, and reactive sulfur concentration to assess FFA corrosion risk for various commonly used natural oils in renewable applications. By considering these parameters, the model provides a comprehensive framework for evaluating corrosion risk and metallurgical performance in RD/SAF units. This pioneering solution offers an easy-to-use tool to enhance the reliability of unit piping and equipment in renewable fuel production facilities.
State-run China National Offshore Oil Co, one of the country’s top importers of Russian oil, has in recent months been pumping shipments of ESPO blend from Russia’s Far East into a newly launched reserve base, according to traders and tanker trackers.
This is the first time stockpiling of Russian ESPO blend crude at CNOOC’s new reserve base has been reported. CNOOC did not have an immediate comment.
The stockbuild, estimated at more than 10 million barrels by tanker tracker Vortexa Analytics, helped lift China’s seaborne imports of the flagship Russian export grade to a record high in March, supporting prices of the ESPO blend despite tepid demand from independent Chinese refiners.
Though less than China’s crude consumption in a day, the stockbuild cements Russia’s position as China’s top oil supplier and comes as sales to India, Moscow’s No.2 oil client since the war in Ukraine, slowed due to western sanctions-driven difficulties over payments and shipping.
CNOOC began pumping the Russian crude last November into the 31.5 million-barrel storage base it has built in east China’s Dongying port, according to trading sources and Vortexa.
“ESPO discharges into Dongying began surging … after the port put into use three new berths able to dock Aframax vessels,” said Emma Li, Vortexa’s senior China oil analyst. Each ESPO cargo is about 100,000 metric tons or 740,000 barrels and the oil is typically carried in Aframax-sized tankers.
Vortexa did not specify whether the 10 million barrels were part of CNOOC’s commercial stockbuild or for China’s strategic petroleum reserve, but two senior traders who closely track ESPO flows said Beijing has been boosting its emergency stockpile.
“This is part of what the government has repeatedly called for, which is to hold the bowl of energy security firmly in our own hands,” one of the traders said on condition of anonymity given the sensitivity of the matter.
China, the world’s largest crude oil buyer, tightly guards information on its emergency government stockpile and private estimates of China’s strategic reserve vary widely.
Vortexa put China’s strategic reserve levels at 280 million barrels, while consultancy Energy Aspects pegged them at 400 million barrels. By comparison, the U.S. Strategic Petroleum Reserve stands at roughly 364 million barrels.
Russian oil arrivals into China, including via pipelines under long-term contracts, rose one quarter last year to a record 2.14 million barrels per day (bpd), making Moscow its top supplier for a second straight year, ahead of former top provider Saudi Arabia’s 1.72 million bpd.
China’s National Food and Strategic Reserves Administration did not respond to a Reuters request for comment.
‘SAFEGUARD NATIONAL ENERGY SECURITY’
Overall, about 29 million barrels of ESPO blend were discharged between November and March into Dongying port, of which 19 million barrels were sold to independent refiners known as teapots while the rest was stockpiled, according to Vortexa.
At 10 million barrels, the stockpile would occupy one-third of the capacity at the CNOOC-built Dongying storage site, which began operation in February 2023. China processes roughly 15 million barrels of crude oil a day.
The 6.4 billion yuan ($885 million) tank farm is a tie-up to “jointly safeguard national energy security”, the Shandong provincial government said last year when the storage site was launched.
The site, situated near CNOOC’s offshore oilfields, also helps CNOOC market its own production to Dongying, home to 32 independent refineries.
Before last November, the Dongying site was used mostly to store offshore crude and fuel oil, Vortexa’s Li said.
China’s overall seaborne ESPO imports hit a record 28.7 million barrels in March, data from analytics firm Kpler showed.
Of that, CNOOC purchased a record 8.5 million barrels in March, of which 7.4 million barrels were imported at Dongying, Kpler data showed. This compares with 5.2 million barrels imported at Dongying each in January and February, 3.7 million barrels in December, and 1.4 million barrels in November when ESPO imports to the site began.
“Lower demand from India prompted more Russian oil sales to China as really there are not many countries that can take Russian oil now,” an ESPO dealer said.
($1 = 7.2330 Chinese yuan)
By Reuters / Chen Aizhu and Florence Tan , April 15, 2024
OPEC+ once again extended its oil production cuts this month. The decision was anything but unexpected and, unlike previous production policy announcements, it had the desired effect on prices. However, it could only work for so long. Soon, OPEC will need to make a decision.
Last year, oil traders were almost exclusively focused on demand and threats thereof, especially in China. This year, they are beginning to understand that withholding 2.2 million barrels of oil daily while global demand actually rises will, at some point, start eating into supply. Oil prices are on the rise.
True, some OPEC+ members have been producing more than their assigned quota, and they have been asked to take steps to compensate, which normally means temporary deeper cuts. But it seems that overproduction—and the rising output of quota-exempt Iran, Venezuela, and Libya—has not interfered with the purpose of the cuts. Only they cannot continue forever.
Some analysts have noted in the past few months that OPEC+ will have to start unwinding the cuts at some point, especially if Brent crude tops $100 per barrel. The argument made by these analysts is that at that point, prices will start destroying demand as they usually do.
Yet OPEC+ may decide to stick with the cuts until oil is well above $100, according to the CEO of Dubai-based consultancy Qamar Energy, Robin Mills. In a recent opinion piece for The National, Mills suggested sticking with the cuts is one of the two roads ahead of OPEC, with all foreseeable consequences, such as higher inflation and higher U.S. production. The other road Mills describes as OPEC believing its own strong demand forecasts and unwinding the cuts. This is definitely one way of framing the road ahead. In the same vein, however, one could argue that sticking to the cuts is also a sign of belief in OPEC’s strong demand expectations: if demand is so resilient and prone to expand, it will expand even in a higher-price environment.
This is precisely what happened in 2022 when the start of the Russia/Ukraine conflict pushed oil above $100 per barrel and held it there long enough for the annual average to come in at close to $95 per barrel. Demand during that year of high oil prices rose by over 2.5 million barrels daily. And that was before China came roaring back from the pandemic lockdowns, which only ended in late 2022.
So, while it would make sense to expect OPEC+ to start thinking about putting an end to its production cuts, it might make more sense to keep them in place—not least because an unwinding of the cuts would have about the same effect on prices as the news that U.S. shale output grew by over 1 million bpd last year.
OPEC expects oil demand this year to grow by 2.2 million bpd. With the cuts in place, this rate of demand growth is certain to push the global market into a deficit. Estimates of the size of this deficit vary, with the IEA seeing a “slight” deficit as a result of the OPEC+ cuts and stronger demand prompted by the Red Sea situation. Qamar Energy’s Mills, however, sees a deficit of as much as 4 million barrels daily developing later in the year.
Should this happen, there would be nothing easier for OPEC than announcing an end to the cuts, or at least a tweak, to avoid a price slump. And a deficit environment would be the best time to make these tweaks—with prices high and demand resilient, the effect of such an announcement on prices would be mitigated by the fundamentals. Because the cuts can’t go on forever, not when some OPEC members are already grumbling against the quotas.
Speculators are often drawn to organisations that have a track record of failure and no revenue or profit because of the thrill of investing in a business that has the potential to turn a profit.
However, the truth is that investors will typically collect their loss share when a company has annual losses over an extended period of time. A business operating at a loss has not yet demonstrated its worth through profits, and soon outside funding may stop coming in.
Even in this day of tech-stock blue-sky investing, a lot of investors stick to a more conventional approach, purchasing stock in successful businesses like Aegis Logistics. Now, this is not to argue that the business offers the greatest investment opportunity available, but business success largely depends on profitability.
From a COVID low of 2020, the company has given a return of 190 percent. But the stock has been volatile for the past one year just giving a return of 20 percent. So, should you take the opportunity of this consolidation to invest for the long term? Well, for that let’s understand the business of Aegis Logistics and what the future holds.
Corporate Overview Of Aegis Logistics
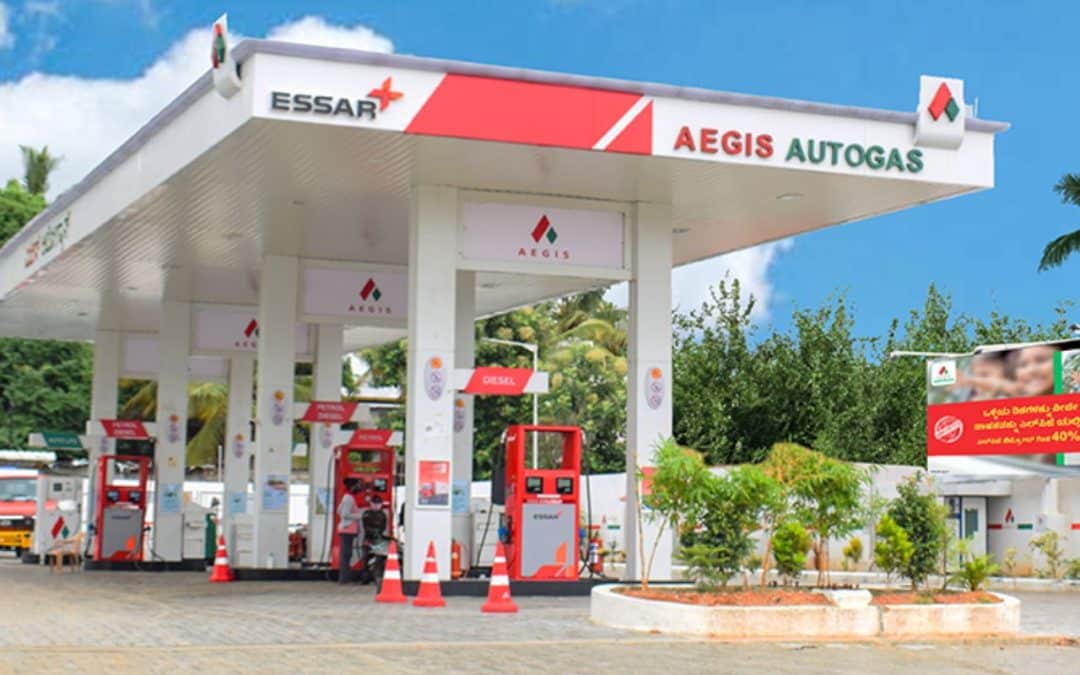
Aegis Logistics is the top private player in India for LPG imports and handling, and it leads the country in integrated oil, gas, and chemical logistics. The company uses its cutting-edge Necklace of Liquid & Gas terminals, which are located in India’s main ports and have a static capacity of 1,14,000 MT for LPG and 15,70,000 KL for Chemicals & POL storage.
With its headquarters located in Mumbai, Aegis Group was established in 1956. Aegis Logistics is a well-known Liquefied Petroleum Gas (LPG) parallel marketer with a strong presence in India.
The company has a sizable network of distributors that offer LPG cylinders and appliances to residential, commercial, and industrial clients. It also has a large distribution of retail outlets that dispense autogas.
To help major enterprises switch from alternative fuels to LPG and optimize their economic benefits, Aegis also offers LPG installation and interfuel services.
Business Segments Of Aegis Logistics
The company has two primary business segments – the Liquid Logistics Division and the Gas Division.
Liquid Logistics Division
Revenues from liquid terminalling increased by approximately 54.80% to ₹417.97 crore from ₹270.01 crore in the prior year. The division’s EBITDA also increased, reaching ₹271.50 crore from ₹195.59 crore. This segment contributed the highest percentage to the overall revenue.
The product mix and the capacity increase at Mangalore, Kandla, and Haldia increased EBITDA performance by 38.81%. Future capacity increases at Haldia, Kandla, Mangalore, and Kochi, along with increased capacity utilization and a better mix of products handled at those ports, will drive growth in this segment. The Mumbai terminals are still operating at maximum capacity.
Gas Division
Aegis Group encompasses the entire logistical value chain, from LPG distribution to sourcing and terminalling. Due to increased volumes and prices, the division’s revenues in FY 2022–2023 were ₹8,209.25 crore as opposed to ₹4,360.97 crore in the prior year.
The Gas division’s EBITDA climbed to ₹526.23 crore from ₹389.32 crore the year before, mostly as a result of increasing terminalling and distribution volumes. This segment contributed almost 95 percent to the overall revenue.
For FY 2022–2023, distribution of LPG and propane across all channels in bulk and packaged cylinders remained a priority. The integrated logistical services offered by Aegis Group position the company to win market share and realize the aim of a more sustainable future, while the continuous development indicates an increasing demand for LPG.
Financials Of Aegis Logistics
In the fiscal year 2023, Aegis Logistics saw a substantial increase in revenue, surging by 86.3% to reach ₹8,627.21 crore as opposed to ₹4,630.98 crore in FY2022. Analyzing a span of four years, encompassing FY2020 to FY2023, the company displayed a Compound Annual Growth Rate (CAGR) of 6.3% in revenue.
Simultaneously, there was a noteworthy upturn in net profit, experiencing a 33% increase from ₹384.94 crore in FY2022 to ₹510.7 crore in FY2023. Over the cumulative four-year period from FY2020 to FY2023, the net profit showcased 56.21% CAGR.
In FY23, Aegis Logistics maintained favorable financial metrics with a Return on Equity (ROE) of 17.88% and a Return on Capital Employed (ROCE) of 17.08%.
Future Plans Of Aegis Logistics
Better Economics With LPG
According to the Kelkar Committee report, the industrial sectors primarily rely on imported LNG, which costs INR 45.6 per scm, while domestically produced natural gas is primarily utilized for PNG in households and CNG in automobiles. Compared to propane LPG, which costs INR 42.2 per square meter, this is more expensive.
Furthermore, the heat content of natural gas is 10,000 Kcal/scm while that of propane is 12,467 Kcal/scm. Propane uses less energy density and has a higher calorific value to generate the same amount of heat. Therefore, propane is less expensive than natural gas at INR 3.38 per million calories compared to INR 4.56 per million calories for natural gas.
To get LPG gas at a lower cost, Aegis Logistics has a joint venture (JV) with Itochu Corporation, a Japanese multinational corporation. This allows AEGIS to offer more competitive propane LPG rates in the industrial gas market.
New Storage for Green Ammonia
Aegis Logistics and Royal Vopak NV, a Dutch multinational company that specializes in the storage and management of a range of products, including chemicals, oil, gases, biofuels, and vegetable oils, have formed a 51:49 joint venture known as Aegis Vopak Terminals Ltd (AVTL).
Across five important Indian ports on the east and west coastlines, this joint venture oversees 11 terminals. With a total capacity of over 960,000 cubic meters, AVTL is becoming a significant participant in the independent LPG and chemical tank storage market in India.
The company’s next phase of growth would involve investing INR 1,000 crore to build a plant in Odisha that can store 80,000 tonnes of green ammonia.
Robust Expansion Plans
The company has several upcoming port construction projects that will boost the capacity of the Liquids division in the future. The Kandla Port which has a capacity of 35,000 KL is expected to commission in Q4FY24.
The company expects the JNPT Port which has an 110,000 KL capacity to be commissioned in phases and will be fully operational by June 2024. The Mangalore Port which has a 76,000 KL capacity is also expected to be partially operational by the end of FY24 and the balance in Q1FY25.
Conclusion
After understanding Aegis Logistics’ financials, growth drivers, and future expansion plans, it seems the company is well-positioned for long-term growth. With strong profitability, increasing capacity, and focus on the high-potential LPG market, Aegis could continue its upward trajectory.
However, with some recent volatility, investors should assess if the current valuation prices are too much for future optimism. What do you think – is Aegis’ growth story still intact and is now the time to buy in?
By: Tank Terminals / Trade Brains , April 09, 2024
Vitol, the foremost independent commodity trader globally, has for the second consecutive year, secured profits surpassing its competitors, solidifying its status as a dominant force in the international energy markets.
Headquartered in London, the privately-owned conglomerate recorded a net profit of $13 billion in 2023, as reported by individuals familiar with the company’s financial performance.
According to a Financial Times report, although down from the record $15.1 billion Vitol made in 2022, the net profit figure is more than three times higher than the $4 billion it reported in 2021, illustrating how much Vitol has benefited from disruption to energy markets in the past two years.
Russia’s invasion of Ukraine
Russia’s invasion of Ukraine in February 2022 sent energy prices soaring as the west responded with sanctions, leading to one of the biggest shifts in global commodity flows in history. Price volatility eased in 2023, but commodity flows remain disrupted.
According to the report, Vitol does not publicly release its financial results, which are only available when its accounts are filed in the Netherlands later in the year.
The company declined to comment on the profit figure, which dwarfed its biggest competitors and was larger than some of the world’s biggest oil producers, including Italy’s Eni.
Lower commodity prices meant turnover fell to $400 billion from $505 billion in 2022 but the total volume of energy products traded by Vitol increased by 4% year-on-year, last month’s statement said.
The growth was driven by gas and liquefied natural gas volumes, which grew by 19% and 24% respectively. The volume of oil and refined petroleum products that the group traded remained roughly flat at 7.3 million barrels per day.
Vitol’s closest rival Trafigura made net profits of $7.2 billion in its last financial year, which ended in September, while fellow privately held energy trader Gunvor made $1.3 billion, it said last week.
Bumper payout
The report noted that the second consecutive blockbuster year will mean another bumper payout for Vitol’s approximately 450 senior partners spread across the trading hubs in London, Geneva, Singapore and Houston.
It will also add to the cash pile Vitol has available to expand the business. In 2022 the group doubled its shareholder equity to $25.8 billion, according to its last set of accounts.
Vitol has already begun spending some of the windfall, launching in January a €1.7 billion bid to acquire Italy’s Saras, which owns the biggest single refinery in the Mediterranean on Sardinia. Last year its Turkish subsidiary Petrol Ofisi agreed to acquire BP’s downstream business in Turkey. On completion, Vitol will have invested in about 9,000 petrol stations worldwide, including 3,900 it owns in Africa through Vivo Energy.
In the UK, Vitol owns and operates five power plants through its partially owned subsidiary VPI, making it a bigger power generator than Centrica. VPI also has three more power facilities being built in the region — two in the UK and one in Ireland.
The panel’s next meeting is scheduled to be held on June 1, ahead of a planned full OPEC and OPEC+ ministerial meetings, which are expected to decide whether to proceed with the current level of cuts beyond June or reverse some of the reductions.
After the meeting today, Ole Hansen, Head of Commodity Strategy at Saxo Bank, commented,
“Brent crude oil toys with $90 after OPEC+ decided to stick with oil supply cuts for the first half of the year, keeping global markets tight and potentially sending prices higher.”
Brent Crude was up by 0.73% at $89.61 early on Wednesday ahead of the weekly EIA inventory report.
In early March, the members of the OPEC+ alliance that had pledged the Q1 cuts announced they would roll over the supply reductions until the end of the second quarter.
Saudi Arabia, Iraq, the United Arab Emirates (UAE), Kuwait, Kazakhstan, Algeria, Oman, and Russia are now cutting their respective crude oil production and exports in the first half of 2024 with extra voluntary reductions, on top of the voluntary cuts OPEC+ previously announced in April 2023 and later extended until the end of 2024.
Russia will be cutting oil production instead of exports in the second quarter of 2024 so that all OPEC+ producers that reduce output contribute equally to the cuts, Russian Deputy Prime Minister Alexander Novak said last week.
The OPEC+ group is set to continue with its production cuts until at least the end of the first half of 2024 as the alliance’s Joint Ministerial Monitoring Committee (JMMC) did not recommend any changes to output policy at its meeting on Wednesday.
The JMMC is the OPEC+ panel that monitors the situation in the oil market and assesses compliance with the cuts. It doesn’t take decisions on policy as it just recommends possible actions to the full OPEC+ ministerial meetings.
After a short regular meeting today, the panel did not recommend to the OPEC+ ministers any change to the current levels of production, as widely expected.
INEOS has completed the acquisition of TotalEnergies’ 50% share of Naphtachimie (720 ktpa steam cracker), Appryl (300 ktpa polypropylene business), Gexaro (270 ktpa aromatics business) and 3TC (naphtha storage) announced on 5 July.
These businesses had previously been joint ventures between the two companies. A number of other infrastructure assets have also been acquired including part of TotalEnergies ethylene pipeline network in France.
INEOS will now fully integrate the Naphthachimie, Gexaro and Appryl petrochemical businesses, assets and infrastructure into INEOS Olefins & Polymers South at Lavera in Southern France. Gexaro, which is located on the Lavera refinery site will continue to be operated by Petroineos.
Xavi Cros, CEO of INEOS Olefins & Polymers South adds: ‘We are pleased that we have today completed the acquisition of TotalEnergies petrochemical assets at Lavera. This is a major step forward for the INEOS French and South European businesses. We will now fully integrate these assets and enhance the competitiveness of our offer.’
By Tank Terminals, April 02, 2024
GDPR Consent
Our website uses cookies. Click on the 'Accept all' button to accept the cookies and on the 'Settings' button for more information and settings.