

Impact of OPEC+ conflict and COVID-19 on Tank Storage Demand in Main Oil Hubs (part 3)
Recap second quarter 2020
FROM THE TANKER VISITS AND MARINEGROSS TRADE OF TERMINALS WITH WATER ACCESS, IT WAS CONCLUDED THAT, DUE THE COVID-19 PANDEMIC, DEMAND FOR FUELS HAD BEEN SEVERELY WEAKENED. THIS RESULTED IN LESS PRODUCT BEING MOVED TO AND FROM TERMINALS, AND THE TREND THAT WAS ALREADY VISIBLE IN THE FIRST QUARTER OF 2020 EVEN ACCELERATED IN THE SECOND QUARTER OF 2020. INTELLIGENT LOCKDOWNS, CLOSED BORDERS AND OTHER PREVENTIVE MEASURES IN ALL MAJOR HUBS WEIGHED ON FUEL CONSUMPTION AND INTERNATIONAL TRADE FLOWS.
THE COVID-19 PANDEMIC AND THE SHORT-TERM SUPER CONTANGO HAD A HUGE IMPACT ON FUEL DEMAND, TRADE FLOWS AND STORAGE DEMAND, COINCIDING FOR ALL TRADING HUBS. STATISTICS SHOWED THE VIRUS WAS LONG FROM DEFEATED AND IF COUNTRIES DID NOT TAKE IMMEDIATE PREVENTIVE ACTIONS A SECOND WAVE WAS EXPECTED TOWARDS THE END OF THE YEAR. THIS WOULD MEAN THAT CURRENT MARKET DYNAMICS WILL PERSIST FOR THIS YEAR.
Key highlights third quarter
- Tanker visits in the third quarter dropped to their lowest value in three years but the decrease was less than in prior quarter
- Like the number tanker visits, marine gross trade volumes in the third quarter also fell to their lowest value in three years. Again, the rate of decline was not as strong as in 2Q20
- Berth occupancy rates in the third quarter showed a modest uptick
- Total stocks in the hubs are declining in the third quarter with tanker visits are gradually increasing in the last part of 3Q20
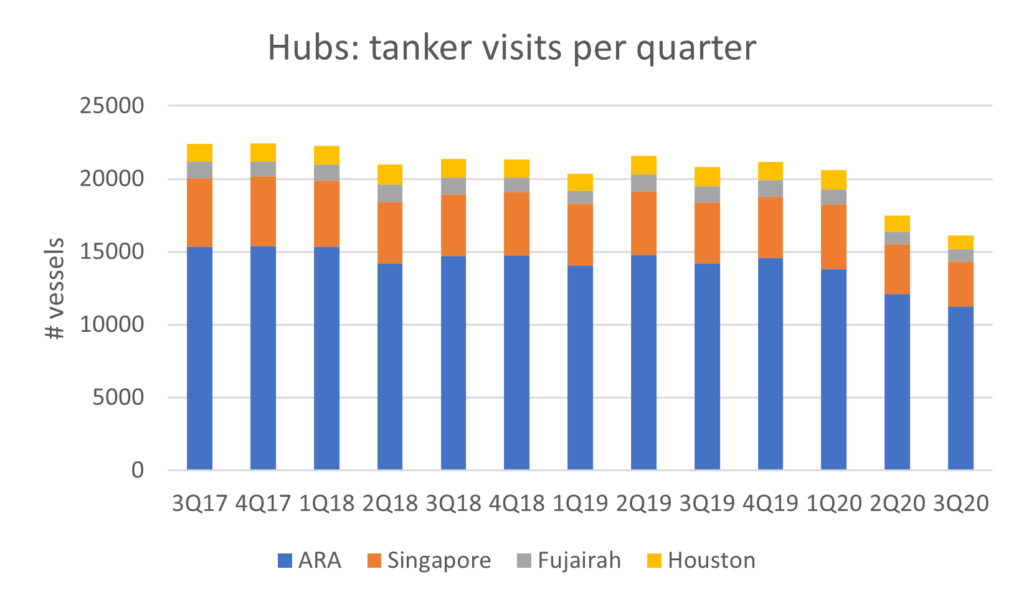
Tanker Visits Per Hub Per Quarter
Looking at all oil tanker visits per hub combined in the graph below, we see that the total number has fallen from the second quarter to third quarter with 8% to 16,126 tanker visits. Comparing the third quarter of this year with the third quarter last year, there is even a 22% decline visible. With the exception of Fujairah, which showed its second lowest value, all hubs in the third quarter showed their lowest value in three years. In the ARA, the number of tanker visits fell from 12,124 to 11,254 which is a 7% decline q-o-q. Comparing y-o-y, tanker visits in Europe’s main hub decreased by 21%. In the Asian hub, Singapore, the number of tanker visits fell from 3,393 to 3,072. That is a 27% decline y-o-y and a 9% decline q-o-q. Houston showed, with 937 tanker visits, the largest drop, q-o-q with 15% and y-o-y with 29%. As stated before, Fujairah, with 863 tanker visits, showed its second lowest value in the third quarter. On a quarterly basis, tanker visits rose by 1% while on yearly basis, tanker visits dropped with 22%. Looking at the consolidated numbers of the hubs, we see that pace of decline is slowing. From 1Q20 to 2Q20, the number of ship visits fell from 20,586 to 17,474 or 15% while from 2Q20 to 3Q20, we saw a 8% decline. The slower pace of decline is mostly the result that as from mid-August the number of oil tanker visits started to improve modestly.
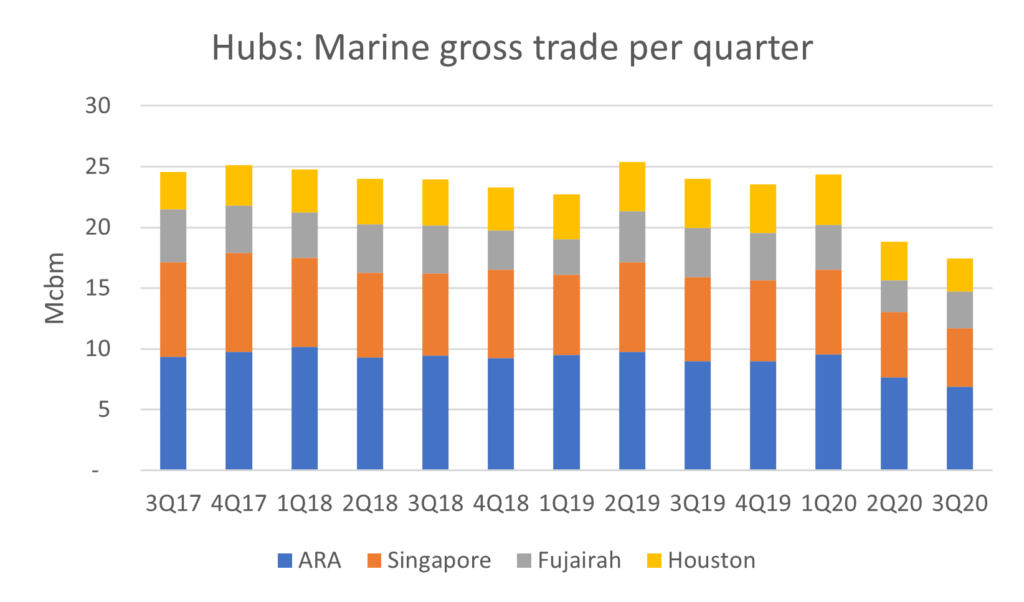
Marine Gross Trade Per Hub Per Quarter
The marine gross trade numbers show a similar pattern in relation to the tanker visits. For all hubs combined the marine gross trade figures dropped from 18.8Mcbm in the second quarter of 2020 to 17.4Mcbm in the third quarter of 2020, reflecting a decline of 7%. On yearly basis, comparing 3Q19 with 3Q20 marine gross trade numbers shaved some 23%. Again the value of 3Q20 was the lowest value in three years’ time and this applied for all hubs with the exception of Fujairah. In the ARA region, marine gross trade volume edged 10% lower on quarterly base to 6.9Mcbm and 24% lower on a yearly base. In Singapore, marine gross trade volumes decreased by 10% to 4.8Mcbm q-o-q while in Asia the volumes dropped with 30% year-on-year. In Fujairah volumes in the third quarter were 3Mcbm compared to 2.6Mcbm in the second quarter. That is a 14% build q-o-q but on a yearly basis it is still 25% lower. Houston showed the largest drop quarter-on-quarter (14%) and year-on-year (33%). The marine gross trade volume in the third quarter stood at 2.7Mcbm.
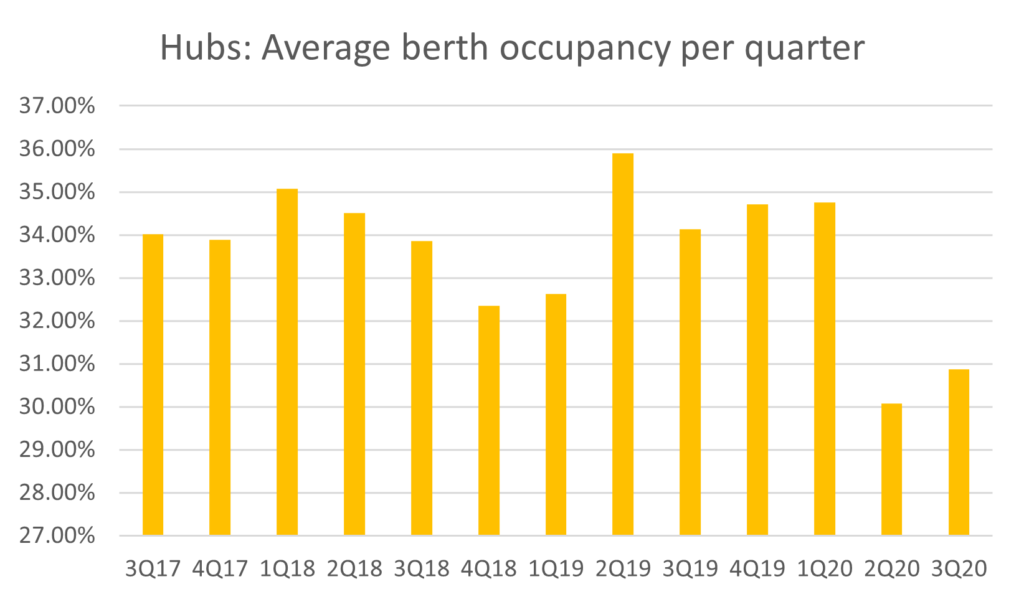
Berth Occupancy Per Hub Per Quarter
With the exception of Houston, similar patterns were seen for ARA, Singapore and Fujairah when looking at the average berth occupancy of the local marine terminals. The berth occupancies at these hubs still stood at their second lowest value since 2017 but showed a minor uptick compared to the second quarter of this year. The berth occupancy rate for all hubs combined rose from an occupancy of almost 30% to almost 31%. In the ARA region, average berth occupancy rates rose from 31% to almost 31.5% in the third quarter. In Singapore, average berth occupancy rates grew from 29.5% to 30% while in Fujairah, occupancy rates jumped from 29.5% to 32.2%, making it the biggest mover. Berth occupancy rates in Houston fell from 30.3% to 29.7%.
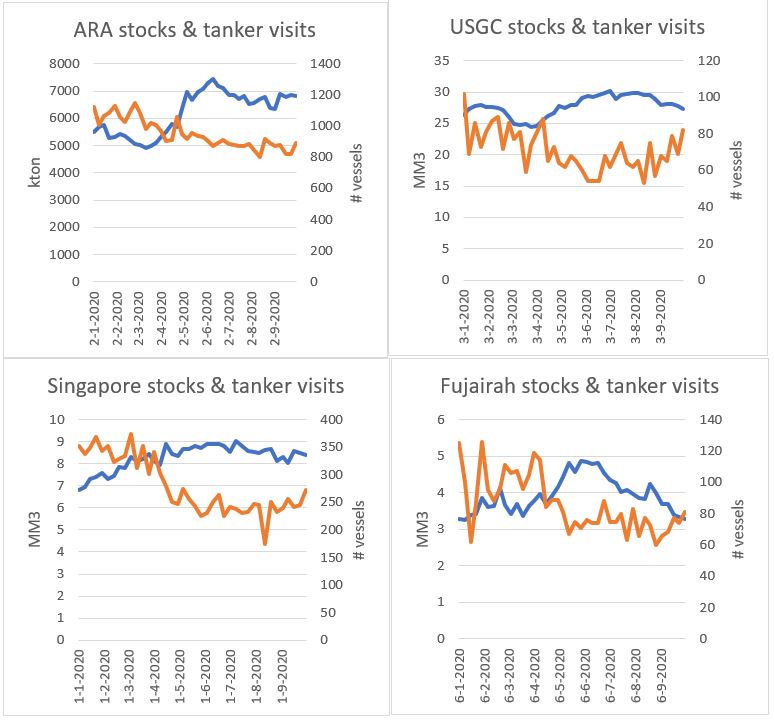
Stock numbers versus tanker visits
Total stocks combined (including light ends, middle distillates and heavy end stocks) showed similar patterns like the number of tanker visits as already explained. It seems that in most trading hubs total stocks peaked around the middle of the year (June) and then started a modest descent in the third quarter. The rise in stocks was a combination of fuel demand destruction and the presence of the super contango due to the impact of COVID-19. The number of tanker visits shows a contradictive pattern, with the number of visits kind of bottoming out as from the middle of the year.
Conclusion
The number of tanker visits in the third quarter of this year kept decreasing for all primary trading hubs. However, the pace of decline was less strong than in the second quarter. The weaker contraction rate came from a recovery of ship movements in the last four weeks of the quarter. The same pattern was visible for marine gross trade volumes. Average berth occupancy rates for all hubs showed a modest increase. These developments combined with lower stocks indicate that the easing of the COVID-19 lockdown measurements during the summer period have supported trading and shipping dynamics at global trading hubs.
So although fuel demand remained very weak some indications of improvement were visible. Worrying is that in September the numbers of Corona infectious globally started to rise again. This situation led most countries to undo the relief of restrictive measures. In these countries harsh actions have been introduced to further limit travel movements and social contacts of people. Obviously this will lead to less fuel demand in the transport industry and thus less trading and business activity at the terminals.
It is expected that, with a continuation of the restrictive measures in the world well into December and January, the number of tanker visits and marine gross trade volumes remain depressed. Recovery will go hand in hand with the introduction of a vaccine. However, expectations are that numbers and volumes will still not be on the level as before the Corona pandemic.
About the authors and the data
The data in this report was extracted from the Tankterminals.com database and Insights Global’s weekly ARA Oil Product Levels publication. The data in Tankterminals.com came specifically from the Logistical Performance Benchmarking addon, which uncovers information on certain terminal performance indicators such as occupancy rates and turnaround times at berth level of a terminal. To analyze the hubs, all the berth data from the various terminals located in these specific hubs was aggregated and offered these unique insights. Tankterminals.com has data on the logistical performance dating back till the third quarter of 2017. Insights Global’s weekly ARA Oil Product Levels publication is a well-established report in the international oil trading business. Insights Global has data going back to 1995.
Jacob van den Berge has been working for Insights Global for more than 8 years and has 10 years of experience in the oil & gas industry. Currently he is the Head of Marketing and Sales but used to work as an oil market analyst and industry consultant for the company.
Contact Insights Global if you would like to discuss how our data driven company can add value to your organization by enabling intelligent decisions.
Having access to accurate, up-to-date oil storage rates is crucial to make the right business decisions.
With our Global Oil Storage Rate Report, you’ll gain access to the single and only authoritative source of storage rate information available worldwide. It will provide you with transparency on price levels in global tank storage markets regularly, so you are always in the know and can set the right ask and bid prices for your storage.
Download your FREE Sample Report now and discover what information you could have at your fingertips each quarter.