
Impact OPEC+ conflict and COVID-19 on Tank Storage Demand in Main Oil Hubs (part 2)
Recap last quarter blog article
In the last blog article, we explored the impact of the super contango and COVID-19 on tank storage demand in the four major oil trading hubs Amsterdam-Rotterdam-Antwerp (ARA), Houston, Singapore, and United Arab Emirates (UAE).
We concluded that the main trading hubs showed similar patterns by looking at the statistics of tanker visit numbers, marine gross trade and average berth occupancy rates, especially in the first quarter of 2020 in which the defining events OPEC+ conflict and COVID-19 evolved.
We said that in the first quarter of 2020 the number of tanker visits of the different hubs was at a minimum while the average berth occupancy rates were at their second highest since the third quarter of 2017. The low number of tanker visits was likely to have been caused by 1) high fill rate or almost full tanks of terminal operators due to contango storage play options and 2) lower consumption levels due to demand destruction by COVID-19.
The high berth occupancy rates can be explained by the fact that, despite the low number of tanker visits, in the first quarter of 2020 terminal operators were coping with the impact of IMO legislation to their business operations which might have resulted in a bit slower vessel handling at the terminals.
In this blog article we will focus on the second quarter of this year when the pandemic – in certain areas – was at its height. We will analyze what the impact of the super contango and COVID-19 had on tank storage demand in the major trading hubs has been, individually and combined.
Tanker Hub Visits Per Quarter
For all trading hubs consolidated the number of tanker visits dropped to a new low in the second quarter of 2020, with 13% less tanker visits compared to the previous quarter and even 19% less tank visits compared to the same quarter a year ago. Looking at the tanker visits trend (figure 1), all trading hubs show a similar trend with a continuation of the downward trend in 2020. For all hubs, with the exception of Fujairah, in the second quarter of this year the minimum value of tanker visits was reached since the third quarter of 2017. For Fujairah it was the second lowest number. The 2Q20 value for ARA was 12,184 tanker visits which is 10% lower q-o-q and 18% lower y-o-y. Singapore showed the strongest decrease in comparison with the other hubs. In the second quarter of 2020, the Asian port registered 20% less tanker visits in comparison with the first quarter of the year. The value for 2Q20 was 3,305. In relation with last year’s second quarter, the number of tanker visits was reduced with almost a quarter. In Fujairah there were 893 tanker visits seen in the second quarter of 2020. That was 19% lower than last quarter and 23% lower than the second quarter of 2019. The lowest value in Fujairah was 878 tanker visits in the first quarter of 2019. Houston registered 999 tanker visits in 2Q20. That meant 20% less tanker visits q-o-q and 22% less tanker visits y-o-y.
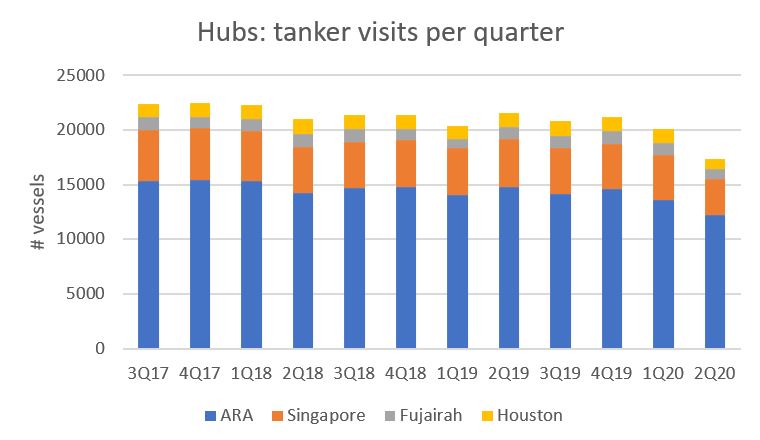
Figure 1: Tanker visits per hub per quarter; source TankTerminals.com
Marine Gross Trade Per Hub Per Quarter
With respect to marine gross trade volumes we see a striking resemblance in the trend of the major trading hubs (figure 2). For all the hubs, it applies that marine gross trade in the second quarter of this year was at its lowest since late 2017. The 2Q20 value in ARA was 7.7Mcbm while its average volume over the last 12 quarters was 9.3Mcbm. That is a 15% drop since last quarter and a 21% drop since last year. In Singapore, the 2Q20 value stands at 5.5Mcbm while the average numbers stands at 6.9Mcbm. This is a 16% decrease q-o-q and a 25% decrease y-o-y. In Fujairah these numbers are even more substantial. The minimum value in 2Q20 was 2.4Mcbm and the average value was 3.6Mcbm. The drop compared to last quarter was 31% and compared to last year even 41%. Houston numbers stood at 2.8Mcbm in the second quarter while the average stood at 3.6Mcbm. This means a q-o-q decrease of 26% and 30% y-o-y. For the hubs combined, we saw 20% drop q-o-q and 27% drop y-o-y.
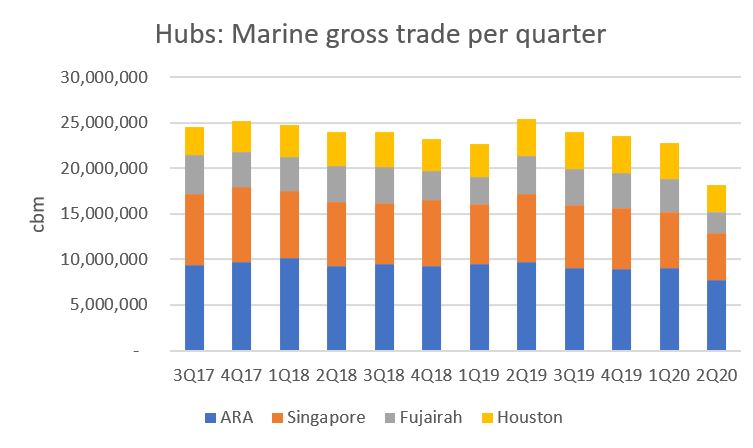
Figure 2: Marine gross trade per hub per quarter; source TankTerminals.com
Berth Occupancy Per Hub Per Quarter
All major trading hubs showed a similar trend in berth occupancy rates in the second quarter of this year (figure 3). The rates showed a decrease compared to the last quarter while for ARA, Singapore and Houston the berth occupancy rates were at their lowest since the third quarter of 2017. For Fujairah, berth occupancy rates showed their third lowest value. The average berth occupancy in the ARA stands at around 32% while 2Q20 value stands at 31%. In Singapore and Houston these values are even more dramatic with an average berth occupancy of both hubs at 33% while the value in the 2Q20 was just below 30%. In Fujairah the average berth occupancy stands at 35.5% and the 2Q20 number was 32%. For the hubs combined we saw an average berth occupancy value of almost 31% (minimum) in the second quarter while the average stood at 33.5%.
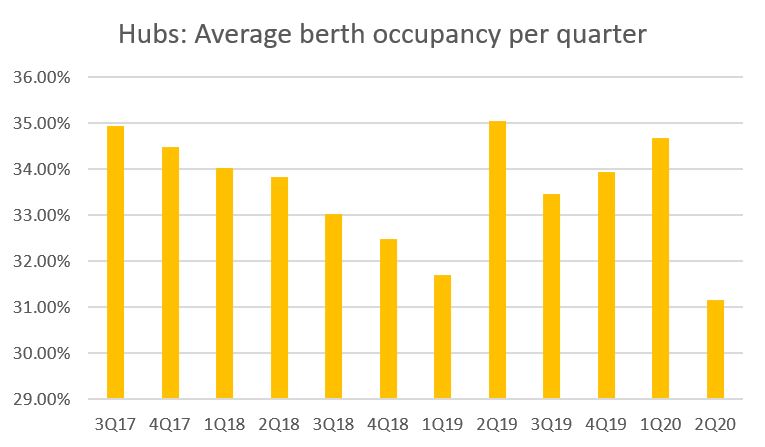
Figure 3: Average berth occupancy per quarter; source TankTerminals.com
Stock numbers versus tanker visits
For all major hubs light end, middle distillates and heavy end stocks combined have been building this year (figure 4). The growth rate for the hubs is different but stock levels show a similar pattern and that is an upward trend. The same relation is visible for the tanker visits although a negative trend as the number of tanker visits for all hubs have been declining.
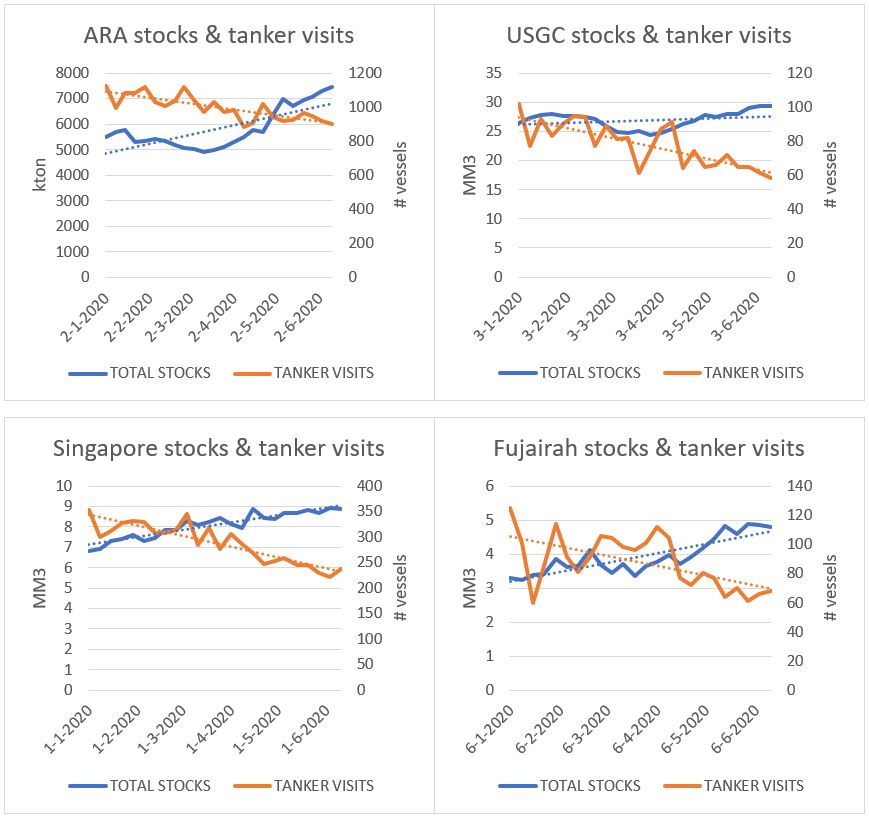
Figure 4: ARA stock levels and tanker visits; source TankTerminals.com
Conclusion
Especially for the tanker visits and marine gross trade of marine terminals it can be concluded that due the COVID-19 pandemic demand for fuels has been severely weakened which resulted in less product being moved to and from terminals. This trend was already visible in the first quarter of 2020 but accelerated in the second quarter of 2020. Intelligent lockdown, closed borders and other preventive measures in all major hubs weighed on fuel consumption and international trade flows.
The lower demand and forthcoming less international transports also led to a rise of consolidated oil product stocks in all major trading hubs. Besides less oil consumption, oil product terminals profited from the super contango which resulted in an additional build of oil product stocks. As the charts in figure 4 show, stock levels rose in 2020 while the number of tanker visits dropped. It is striking to see that all hubs show similar trends.
Berth occupancies in all hubs on the other hand dropped to their lowest since Insights Global started gathering data of terminals’ logistical performance. Also this change has been related to the COVID-19 pandemic impact. We concluded that berth occupancies rose as from the first quarter of 2019 till the first quarter of 2020 due to less efficient vessel handling operations at terminals in the run up to implementation of IMO2020 legislation. We see now that lesser ships handled by the terminals due to COVID-19 destructive demand impact weighed on terminals’ berth occupancy rates.
In general it can be concluded that the COVID-19 pandemic and the short term super contango had a hug impact on fuel demand, trade flows and storage demand, coinciding for all trading hubs. As current statistics show the virus is long from defeated and if countries do not take immediate preventive actions a second wave can be expected on the short term. This would mean that current market dynamics will persist for this and upcoming years.
About the authors and the data
The data in this report was extracted from tankterminals.com database and Insights Global’s weekly ARA Oil Product Levels publication. The data in tankterminals.com came specifically from the logistical performance benchmarking addon, which uncovers information on certain terminal performance indicators such as occupancy rates and turnaround times at berth level of a terminal. To analyze the hubs, all the berth data from the various terminals located in these specific hubs was aggregated and offered these unique insights. Tankterminals.com has data on the logistical performance dating back till the third quarter of 2017. Insights Global’s weekly ARA Oil Product Levels publication is a well-established report in the international oil trading business. Insights Global has data going back to 1995.
Jacob van den Berge has been working for Insights Global for more than 8 years and has 10 years of experience in the oil & gas industry. Currently he is the Head of Marketing and Sales but used to work as an oil market analyst and industry consultant for the company.
Contact Jacob van den Berge if you would like to discuss how our data driven company can add value to your organization by enabling intelligent decisions.
Having access to accurate, up-to-date oil storage rates is crucial to make the right business decisions.
With our Global Oil Storage Rate Report, you’ll gain access to the single and only authoritative source of storage rate information available worldwide. It will provide you with transparency on price levels in global tank storage markets regularly, so you are always in the know and can set the right ask and bid prices for your storage.
Download your FREE Sample Report now and discover what information you could have at your fingertips each quarter.